Severe anemia
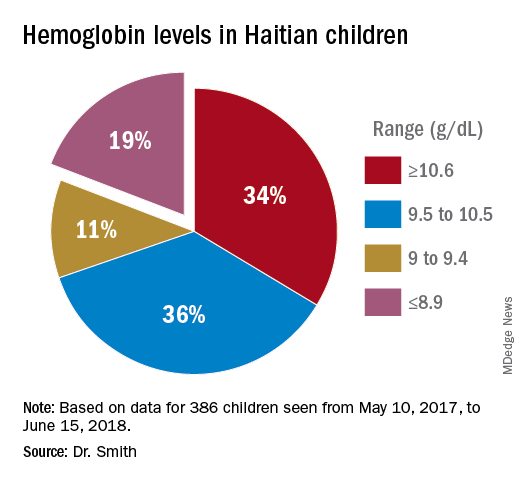
In total, we saw about 386 children, mostly 5 years and under, in Onaville. Toward the end of the 3 months, we were seeing some of those back as follow-ups. One of the first hemoglobins was 4.9 g/dL, with a 5.4 g/dL on repeat. This stunned us. In the first few days, we were seeing what we saw consistently throughout the course of 3 months.
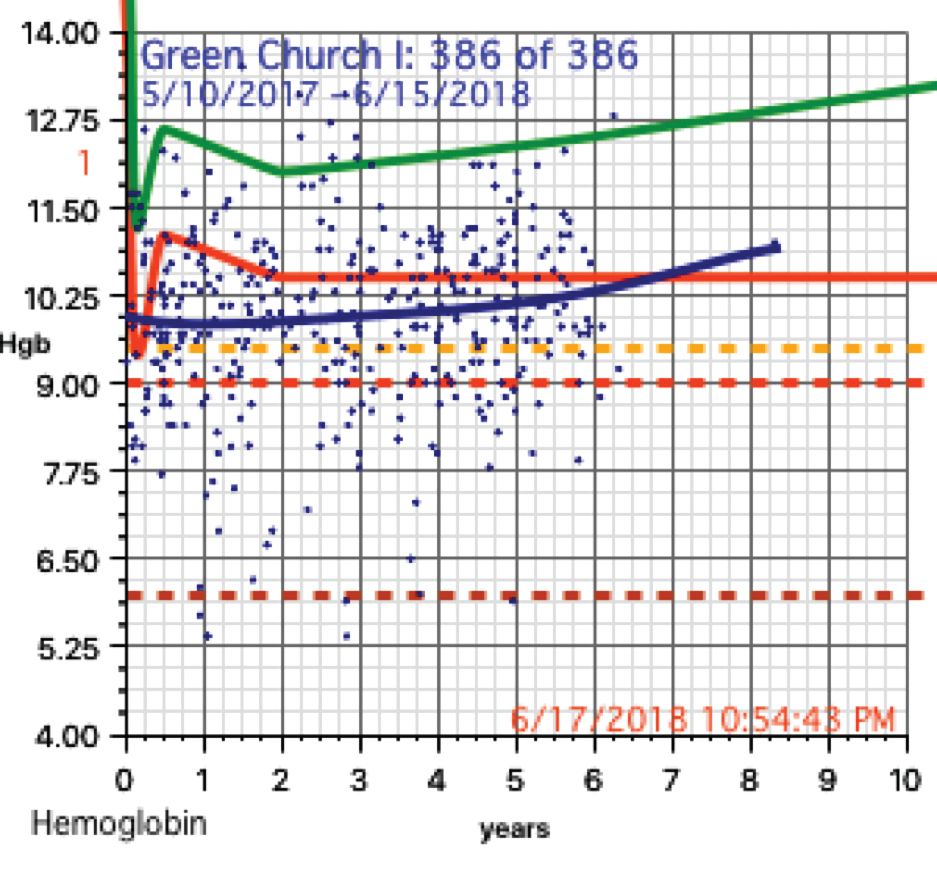
About 19% of these children had hemoglobins from below 9.0 g/dL to below 6 g/dL. More importantly, there was little on physical exam that would trigger one to do a hemoglobin. Low hemoglobins were not associated with yellow-orange hair. No cases of the swelling of kwashiorkor or pencil-like frames of marasmus were seen.
Severe chronic malnutrition
The scatter charts are very telling and the hemoglobin graphs are explosive. What is demonstrated is that this recent population is slowly starving to death. How can the hemoglobins be so very low in comparison to the only slightly lowered mean averages (the solid red line)?
In over 3 decades of pediatric medicine, I rarely have seen children in the United States with hemoglobins below 9.5 g/dL. Often they have other illnesses that clearly point to the cause. Could the 19% of children with severely lowered hemoglobins (below 9.0 g/dL) be caused by sickle cell disease or something else in these Haitian children?
A search for articles where sickle cell was studied revealed a study done at St. Damien Pediatrics Hospital in Port-au-Prince (Blood. 2012;120:4235). The overall incidence of sickle cell disease was this: “Of the 2,258 samples tested, 247 had HbS, fifty-seven had HbC, ten had HbSS, and three had HbSC.” Only 0.57% of these children had sickle or sickle-C disease where one could expect hemoglobins to be as low as in the children of Onaville. Applying that percentage to the 386 children we saw would account for about only 2 children who might have sickling anemia. Yet we had 73 children in our study with severely lowered hemoglobins below 9.0 g/dL. If you estimate that half of the 250,000 people in Onaville are children, that extrapolates to over 47,000 with severe anemia! I think that a study larger than ours needs to be done to better assess that, however.
My best thought is that these children who have little external evidence of abnormality and mildly lowered growth data represent a type of malnutrition that has not been defined, much less addressed. I call this severe chronic malnutrition. The very low hemoglobins indicate to me that this is not simply a lack of iron – although certainly that is a factor – but rather that these children are in a state of chronic protein deprivation. They represent a large pool of children who exist between those with normal nutritional states and those with the kwashiorkor or marasmus of severe acute malnutrition.
A search of the 69,823 ICD-10 codes in my database for “malnutrition” only turns up the ill-defined terms, “Unspecified severe protein-calorie malnutrition,” “Moderate, and Mild protein-calorie malnutrition,” “Unspecified protein-calorie malnutrition,” and “Sequelae of protein-calorie malnutrition.” Whatever each of those means is purely subjective in my opinion.
Without a clear understanding or definition of what is severe chronic malnutrition, we are like the Titanic trying to avoid icebergs on a moonless night. I think we must define severe chronic malnutrition before we really can understand the pathophysiology and treatment of severe acute malnutrition.
The WHO published its last printed monograph, “The treatment and management of severe acute protein-energy malnutrition,” in 1981. This publication is essentially a cookbook approach for what to do, with no clear presentation of the chemical processes and medicine involved. The primary focus for the WHO is mid-upper arm circumference and weight for height. Reading this document might lead one to believe that all malnutrition is acutely severe. It is most certainly not.


