Statistical Analysis
Descriptive statistics were used to analyze collected data. The primary outcome was assessed for the group admitted postintervention by calculating the average number of times each medication on the PRN medication list was used per patient during their length of stay (LOS) as applicable. The administration totals for each medication on the PRN medication list during the postintervention study period were also recorded.
Secondary outcomes were assessed by comparing the recorded total number of ECS visits pre- and postimplementation. Additionally, the average number of ECS visits per admission and the number of avoidable ECS visits were recorded for each study group. The cost reduction from avoided ECS use was estimated by calculating the total cost of ECS used pre- and postimplementation. The difference between the number of avoidable ECS visits in the pre- and postintervention groups was assessed for statistical significance by using a chi-square test. The 2013 cost saving estimation was based on the average ECS visit cost in the 2013 fiscal year ($657). Of note, power for this study could not be calculated as this has not been studied prior; therefore, no precedence has been set.
Results
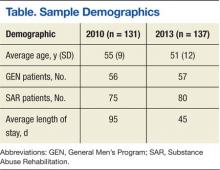
On completion of the data collection, 583 patients were assessed for inclusion into the study, 325 in the 2010 preimplementation group and 258 in the 2013 postimplementation group. A total of 200 patients were randomized in each group (n = 400); however, 69 (35%) and 63 (32%) were excluded from the 2010 group and 2013 group, respectively. Sample demographics are described in the Table.
PRN Medication and ECS Use
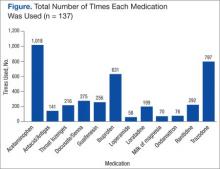
Between April 1, 2013, and September 14, 2013, 3,959 doses of PRN medications were administered to MHRRTP patients who were included in the study (Figure). Prior to accessing ECS for their problem, 22 (36%) of the 61 patients who used ECS had trialed the PRN medication(s).
When comparing the total number of ECS visits, the 2010 group had 145 visits and the 2013 group had 96 visits. The preimplementation group averaged 1.1 ECS visits per MHRRTP admission, whereas the postimplementation group averaged 0.7 ECS visits per admission. The difference in the number of avoidable ECS visits was statistically significant, with the 2010 group totaling 15 avoidable visits, while the 2013 group totaled 1 ECS visit ( P = .0045).
It was estimated that 9 (9.3%) ECS visits were avoided due to the PRN medication list in 2013. Using 137 patients, who were included in the postimplementation group, it can be calculated that $5,867 was saved due to the PRN medication list, or $42.83 per patient in 2013. Using the 2013 MHRRTP census of 898 patients, the financial impact of the PRN medication list can be extrapolated to produce an estimated annual cost savings of $38,461.
Patient and Nurse Satisfaction
Of the 120 patients given the patient satisfaction questionnaire, 28 (23%) patients responded. Of the respondents, 25 (89%) stated they were aware of the PRN medication list. The median rank of satisfaction reported was 8 on a 10-point scale. Twenty-two (79%) patients felt that the PRN medication list had or may have reduced the need to go to ECS or urgent care. Twenty-three (82%) patients recommended not removing any drugs listed on the PRN medication list.


