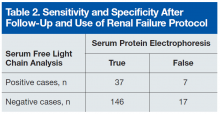
Of the 24 patients with false-positive results, 16 had moderate-to-severe kidney disease (stage IIIa-IV).6All patients in this quadrant were men; their mean age was 75 years, and their mean creatinine level was 182.15 μmol/L. Further laboratory data are listed in Table 2.
The patient whose biopsy results led to an MM diagnosis and the patient whose IFE led to a gammopathy diagnosis both maintained a glomerular filtration rate within normal limits. The Figure shows the κ-to-λ ratios of this quadrant logarithmically.
Discussion
Use of SFLC analysis as a supplement to serum and urine protein electrophoresis has been investigated and accepted in the recent literature.3,4,7,8 Use of light chains as a method of earlier or alternative detection has not been proved. In the present study of 207 patients, comparisons showed that more traditional MM detection methods and SFLC analysis are largely concordant. The 2 patients with MM and negative electrophoretic patterns provided a clear indication of the potential benefit of SFLC analysis in the diagnosis of secretory and nonsecretory myeloma.
In 2014, Kim and colleagues compared 2 SFLC assays (Freelite, N Latex) to each other and to SPEP in a 120-patient population.9 The Freelite results in their study correlated closely with VA population findings (κ-to-λ ratio sensitivity and specificity: 72.2% and 93.6%, respectively). N Latex, the newer SFLC assay, had lower sensitivity (64.6%) and higher specificity (100%). With application of the extended reference range (0.37-3.1) proposed by Hutchison and colleagues for use in patients with renal failure, SFLC becomes a more statistically powerful tool.5
The patients who tested false-positive had higher mean creatinine levels, and 16 had renal insufficiency. The 2 false-positive patients were later found to have clinical myeloma and were within the normal range of renal function. Of the 16 patients with an abnormal κ-to-λ ratio and renal failure, 15 would be within the revised normal reference range, leaving 9 false-positives, 2 of whom eventually were found to have disease. With the application of the extended light chain range (as per Hutchison) for those patients with renal failure, 15 of the original 24 false-positives became true-negatives. Two of the false-positives become true-positives after they were subsequently diagnosed. Therefore, SFLC analysis detected disease in 22% of the revised false-positives when SPEP could not.
Table 2 lists the revised data after follow-up and renal failure correction. The strongest aspect of SFLC analysis remains its 95% specificity; its 69% sensitivity remains relatively constant. The test’s positive predictive value is 84%, and its negative predictive value is 90%. In veteran and other at-risk populations, SFLC analysis proves to be a very powerful tool on its own.
Conclusion
Both patient cases described in this article demonstrate the usefulness of SFLC analysis as an adjunct to SPEP. The authors propose SFLC testing for all patients who are undergoing MM screening with SPEP/IFE. In patients with renal failure, the expanded reference range seems to reduce erroneous false-positive results. Patients who have abnormal ratios should be followed up in clinic with repeat MM testing. It seems clear that, at the very least, SFLC analysis is a necessary adjunct to SPEP testing. However, SFLC stands on its own merit as well.
Author disclosures
The authors report no actual or potential conflicts of interest with regard to this article.
Disclaimer
The opinions expressed herein are those of the authors and do not necessarily reflect those of Federal Practitioner, Frontline Medical Communications Inc., the U.S. Government, or any of its agencies. This article may discuss unlabeled or investigational use of certain drugs. Please review complete prescribing information for specific drugs or drug combinations—including indications, contraindications, warnings, and adverse effects—before administering pharmacologic therapy to patients.


