Statistical Analysis
Descriptive statistics were used to summarize patient demographics and to calculate the frequency of referrals before and during the intervention. Chi-square statistics were calculated to determine whether the change in percentage of referrals and timely referrals was significant. Descriptive statistics were used to determine the level of provider satisfaction related to each survey item. A content analysis method was used to synthesize themes from the open-ended question asking clinicians to share their feedback related to the new protocol.
Results
Fifty-seven patients met the study inclusion criteria: 29 patients during the preintervention phase and 28 patients during the intervention phase. There were 35 male (61.4%) and 22 female (38.6%) patients. Twenty-five patients (43.9%) were from age groups 41 through 60 years and 61 through 80 years, respectively, representing the majority of included patients. Seven patients (12.3%) were from the 81 years and older age group. There were no patients in the age group 18 through 40 years. Based on the AMI READMITS score calculation, 57.9% (n = 33) patients were from a low-risk group (includes extremely low and low risk for readmission) and 42.1% (n = 24) were from a high-risk group (includes moderate, high, and extremely high risk for readmission).
Provider adoption of the new protocol during the intervention was high. Referral forms were completed for 82% (n = 23) of the 28 patients during the intervention. Analysis findings showed a statistically significant increase in documented referrals after implementing the new referral protocol. During the preintervention phase, 66% (n = 19) of patients with type I MI were referred to see a cardiologist or an NP at a post-MI clinic and there was no documented referral for 34% (n = 10) of patients. During the intervention phase, 89% (n = 25) of patients were referred and there was no documented referral for 11% (n = 3) of patients. Chi-square results indicated that the increase in referrals was significant (χ2 = 4.571, df = 1, P = 0.033).
Data analysis examined whether patient referrals fell within the recommended timeframe of 7 days for the high-risk group (included moderate-to-extremely high risk) and 14 days for the low-risk group (included low-to-extremely low risk). During the preintervention phase, 31% (n = 9) of patient referrals were scheduled as recommended; 28% (n = 8) of patient referrals were scheduled but delayed; and there was no referral date documented for 41% (n = 12) of patients. During the intervention phase, referrals scheduled as recommended increased to 53% (n = 15); 25% (n = 7) of referrals were scheduled but delayed; and there was no referral date documented for 21.4% (n = 6) of patients. The change in appointments scheduled as recommended was not significant (χ2 = 3.550, df = 2, P = 0.169).
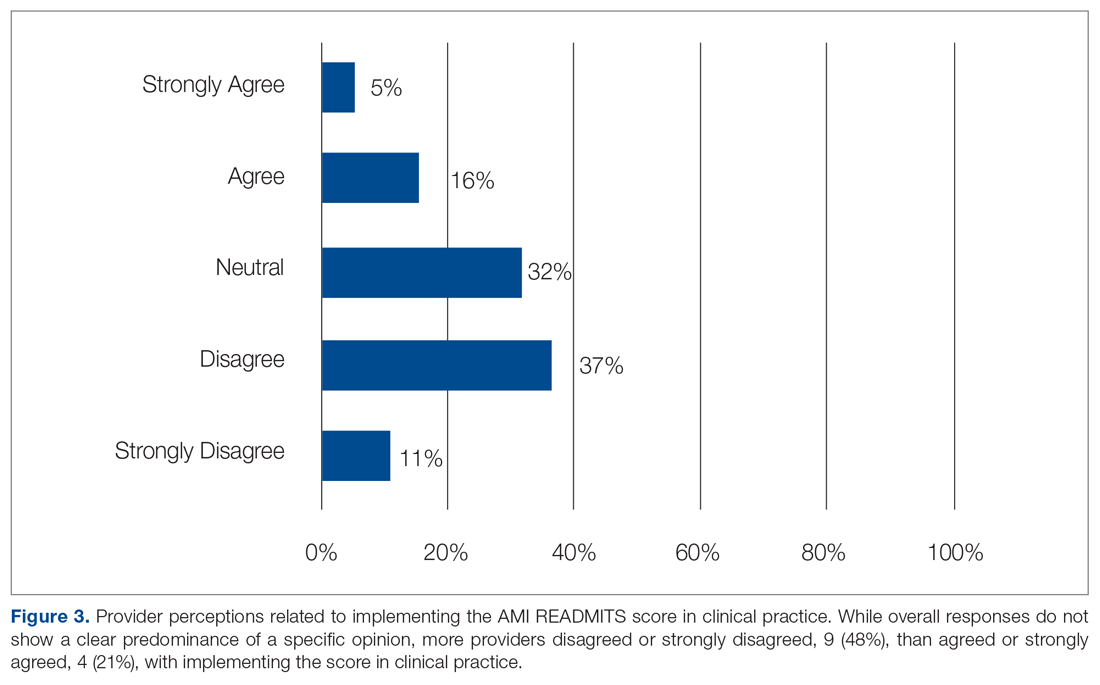
Surveys were emailed to 25 cardiology fellows and 3 cardiology NPs who participated in this study. Eighteen of the 28 clinicians (15 cardiology fellows and 3 cardiology NPs) responded for a response rate of 64%. One of several residents who rotated through the CCU and PCCU during the intervention also completed the survey, for a total of 19 participants. When asked if the protocol was easy to use, 79% agreed or strongly agreed. Eighteen of the 19 participants (95%) agreed or strongly agreed that the protocol was useful in making referral decisions. Sixty-eight percent agreed or strongly agreed that the AMI READMITS risk assessment score improves referral process. All participants agreed or strongly agreed that there should be an option to incorporate the AMI READMITS risk assessment score into electronic clinical notes. When asked whether the AMI READMITS risk score should be implemented in clinical practice, responses were mixed (Figure 3). A common theme among the 4 participants who responded with comments was the need for additional data to validate the usefulness of the AMI READMITS to reduce readmissions. In addition, 1 participant commented that “manual calculation [of the risk score] is not ideal.”

