In the placebo group of 1,152 osteopenic women with no preexisting vertebral fractures, 42 new vertebral fractures occurred (rate: 3.6%). In addition, of 298 women with osteoporosis, 19 new vertebral fractures occurred (rate: 6.4%). Thus, the fracture rate in osteoporotic women is greater, but the prevalence in osteopenic women is much higher. In this case, the ratio of osteopenic to osteoporotic women was 3.9:1. This ratio is not dissimilar to that of 3.4:1 cited in the Surgeon General’s report.5
The Rotterdam study
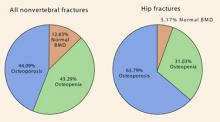
This trial7 followed 4,878 women older than 55 years by obtaining BMD measurements of the femoral neck through DXA scanning for an average of 6.8 years. More than one third of the hip fractures occurred in women without osteoporosis (FIGURE 2). In fact, 5% of the hip fractures occurred in women with normal BMD!
In terms of all nonvertebral fractures, more than half occurred in women without osteoporosis, and 12% occurred in women with normal BMD.
FIGURE 2 The majority of nonvertebral fractures and a significant minority of hip fractures occurred in women not yet osteoporotic—ROTTERDAM TRIAL
Source: Schuit SC, et al.7
The NORA trial
The National Osteoporosis Risk Assessment8 (NORA) also tells us a lot about osteopenic women. This trial was a longitudinal family-practice–based study involving slightly more than 200,000 women. It was a 3-year study with 1 year of follow-up. All women self-reported baseline characteristics and received a peripheral measurement of bone density, either by single-energy x-ray absorptiometry, peripheral DXA, or ultrasound.
The authors applied WHO guidelines for BMD measurement, recognizing that their values were peripheral and might therefore understate BMD values based on central DXA.
Ninety percent of the study population was white. The average age was 64.5 years (range 50–104 years), and 11% had previous fractures. (This fracture rate may underrepresent the actual number of previous fractures because the data were self-reported.) Twenty-two percent had a maternal history of osteoporosis.
These patients may have been healthier than the general population because, in order to be part of the study, they had to have a personal physician. Seven percent of the patients had osteoporosis and 40% had osteopenia, based on the peripheral BMD measurements.
The risk of fracture differed significantly by race. The various relative risks are shown in TABLE 4.
Of the postmenopausal women who sustained new fractures within 1 year of study entry, 82% had peripheral BMD measurements in the osteopenic range.
TABLE 4
Relative risk by race NORA trial
| RACE | RELATIVE RISK (RANGE) |
|---|---|
| Caucasian (reference group) | 1.00 |
| African American | 0.55 (0.48–0.62) |
| Hispanic | 1.31 (1.19–1.44) |
| Asian | 1.56 (1.32–1.85) |
| Source: Siris E, et al.8 | |
So whom do we treat?
As has been observed, osteopenic women clearly constitute the majority of women with fractures, not to mention a sizeable number of women in general. As noted, the T-score range of –1 to –2.49 is wide. It is not feasible to treat the entire osteopenic population. Thus, there is a need to stratify risk.
Miller et al9 attempted to solve this problem by identifying osteopenic women at increased short-term risk of fracture. They analyzed the records of more than 57,000 white women from the NORA trial with peripheral T scores that were osteopenic, and entered 32 risk factors for fracture into a regression-tree analysis. They found 1,130 new fractures that occurred within 1 year.
Signs of imminent fracture
The most important determinants of short-term fracture risk (1 year) were:
- previous fracture regardless of T score (4.1% risk),
- T score of less than –1.8 (2.2% risk),
- poor health status (2.2% risk), and
- poor mobility (1.9% risk).9
These 4 risk factors do not differ substantially from the current National Osteoporosis Foundation guidelines (TABLE 5), which recommend treating all women with previous fractures, T scores worse than –2, or T scores worse than –1.5 with additional risk factors.
TABLE 5
Protocol to prevent osteoporotic fractures National Osteoporosis Foundation
| Calcium intake 1,200 mg/day |
| Vitamin D 400–800 IU/day if risk is high |
| Regular weight-bearing, muscle-strengthening exercise |
| No smoking |
| Moderate alcohol consumption |
| Treatment of all vertebral and hip fractures |
Consider prophylactic treatment if:
|
Looking ahead
The WHO scientific group met in 2004 in Brussels, with representatives from leading organizations, including the American Society for Bone and Mineral Research, the International Osteoporosis Foundation, and the National Osteoporosis Foundation, to name a few. The hope is that we will soon have tools to calculate a 5- or 10-year absolute risk of fracture using multiple parameters such as age, body mass index, smoking, ever use of steroids, previous fracture, family history, and BMD. With such a tool, all we would need to do is establish the level of risk at which pharmacotherapy should be initiated.


