Data are presented as means with corresponding 95% confidence intervals (CIs). Categorical variables are presented as counts with percentages. All statistical analyses were performed with SPSS Version 21.0 (IBM SPSS) statistical software. Statistical significance was set at .05.
Results
During the 1-year period, 8954 department cases involved an implant of any type. Waste occurred in 12% (1072) of these cases. The rate ranged from 8% in the Adult Reconstruction division to 30% in the Trauma division (Table 1), and the rate for individual surgeons ranged from 3% to 100%, though the surgeon with 100% performed only 1 case, and the next highest rate was 50%.
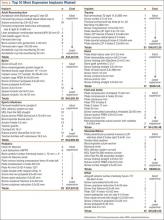
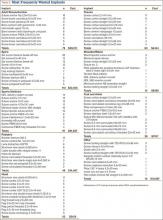
Total implant cost for our hospital during the period was $34,340,607. Of that total cost, 1.8% ($634,668) was lost because of implant waste. Percentage of total implant cost wasted ranged from 1.6% in the Adult Reconstruction division to 4.7% in the Sports Medicine division (Table 1). Percentage of total implant cost wasted for individual surgeons ranged from 0.2% to 16.1%. Tables 2 and 3 list the most commonly wasted implants by count and cost, respectively.
When total cost of wasted implants was averaged over all implant cases performed during the period, the loss resulting from waste amounted to $71 per case for the department and ranged from $21 per case for the Hand division to $105 per case for the Pediatric division (Table 1). For individual surgeons, the loss ranged from $4 to $250 per case.
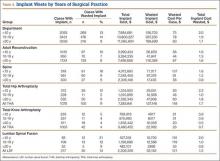
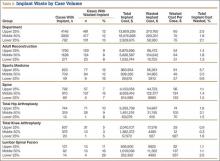
During the period studied, an implant was wasted in 9% (100) of the 1076 primary THAs performed, 4% (42) of the 1003 primary TKAs, and 14% (30) of the 217 lumbar spinal fusions (Tables 4, 5).
There was no significant difference between groups for department (P = .46) or for the Adult Reconstruction (P = .83), Spine (P = .10), or Sports Medicine (P = .69) division. Analyzing for variance by years in surgical practice, we found a significant difference for department (P = .01) but not for the Adult Reconstruction (P = .12) or Spine (P = .14) division. The department difference resulted from a significant difference (P = .001; 95% CI, 1.112-17.408) between surgeons (<10 years of surgical practice) who wasted implants in 12.8% of their cases and surgeons (>20 years of surgical practice) who wasted implants in 9% of their cases (Table 4).
There was no significant difference between groups for department (P = .83) or for the Adult Reconstruction (P = .29) or Spine (P = .41) division when analyzed by years in surgical practice. Analyzing by case volume, we found a significant difference for the Sports Medicine division (P = .004): Percentage of total implant waste was significantly higher (P = .003; 95% CI, –12.61 to –2.97) for surgeons with the lower 25% of case volume (9.8%) than for surgeons with the middle 50% of case volume (3.5%) (Table 5). No other significant difference was found for department (P = .52) or for the Adult Reconstruction (P = .69) or Spine (P = .45) division.
Analyzing by case volume and years in surgical practice, we found no significant difference for department (case volume, P = .76; years in surgical practice, P = .07), Adult Reconstruction division (case volume, P = .47; years in surgical practice, P = .78), Spine division (case volume, P = .11; years in surgical practice, P = .15), or Sports Medicine division (case volume, P = .08).
Selected Procedures
Total Hip Arthroplasty. Regarding variance by case volume and years in surgical practice, we found no significant difference for any variable analyzed: percentage of cases with waste (volume, P = .072; years in practice, P = .076), percentage of total implant cost wasted (volume, P = .074; years in practice, P = .12), cost of waste per case (volume, P = .075; years in practice, P = .32).
Total Knee Arthroplasty. Regarding variance by years in surgical practice, we found no significant difference for any variable analyzed: percentage of cases with waste (P = .38), percentage of total implant cost wasted (P = .50), cost of waste per case (P = .50). Regarding variance by volume, there was no significant difference for percentage of cases with waste (P = .70) or cost of waste per case (P = .05), but we found a significant difference for percentage of total implant cost wasted (P = .038). That difference was caused by an outlier: One surgeon with the lower 25% of case volume wasted an implant in the only TKA he performed that year. Correction for the outlier removed the significance.


