Over the past several decades, patient-reported outcomes (PROs) have become increasingly important in assessing the quality and effectiveness of medical and surgical care.1,2 The benefit lies in the ability of PROs to characterize the impact of medical interventions on symptoms, function, and other outcomes from the patient’s perspective. Consequently, clinical practices can improve patients’ objective findings (from radiographic and clinical examinations) as well as their preferences in a social-psychological context.2,3 As a patient’s satisfaction with a surgical intervention may not correlate with the surgeon’s objective assessment of outcome, PROs offer unique insight into the patient’s perceptions of well-being.4
Health-related quality-of-life assessments can be made with either general-health or disease-specific instruments. These instruments traditionally are administered with pen and paper—a data collection method with several limitations, chief being the need to manually transfer the data into an electronic medical record, a research database, or both. In addition, administering surveys on paper risks potential disqualification of partially or incorrectly completed surveys. With pen and paper, it is difficult to mandate that every question be answered accurately.
Currently, there is a potential role for electronic medical records and digital tablet devices in survey administration and data collection and storage. Theoretical advantages include direct input of survey data into databases (eliminating manual data entry and associated entry errors), improved accuracy and completion rates, and long-term storage not dependent on paper charts.5To our knowledge, there have been no prospective studies of different orthopedic outcomes collection methods. Some studies have evaluated use of touch-based tablets in data collection. Dy and colleagues6 considered administration of the DASH (Disabilities of the Arm, Shoulder, and Hand) survey on an iPad tablet (Apple Computers) and retrospectively compared the tablet and paper completion rates. The tablet group’s rate (98%) was significantly higher than the paper group’s rate (76%). Aktas and colleagues7 reported a high completion rate for a tablet survey of palliative care outcomes (they did not compare modalities). A handful of other studies have found higher intraclass correlation and validation for digital data collection than for paper collection.7-14 The comparability of the data collected digitally vs on paper was the nidus for our decision to prospectively evaluate the ease and reliability of digital data collection.
We conducted a prospective, randomized study to compare the performance of tablet and paper versions of several general-health and musculoskeletal disease–specific questionnaires. We hypothesized the tablet and paper surveys would have similar completion rates and times.
Methods
This study was approved by our Institutional Review Board. Participants were recruited during their clinic visit to 3 subspecialty orthopedic services (upper extremity, spine, arthroplasty). The questionnaires included basic demographics questions and questions about tablet use (comfort level with computers, measured on a Likert scale ranging from 1 (strongly disagree) to 5 (strongly agree), and ownership of a tablet or smartphone). Also included were European Quality of Life–5 Dimensions (EQ-5D, General Health), a disease questionnaire specific to 1 of the 3 subspecialty services, and a satisfaction survey. Patients were asked to complete the Oswestry Disability Index (ODI) for low-back pain, the Neck Disability Index (NDI) for neck pain, the Hip Disability and Osteoarthritis Outcomes Score (HOOS) for hip pain, the Knee Injury and Osteoarthritis Outcomes Score (KOOS) for knee pain, or the QuickDASH survey for upper extremity complaints (subspecialty-specific). After recruitment, a computer-generated randomization technique was used to randomly assign patients to either a paper or an electronic (iPad) data collection group.15 We included all surveys for which patients had sufficient completion time (no clinic staff interruptions) and excluded surveys marked incomplete (because of interruptions for clinic workflow efficiency). For direct input from tablets and for data storage, we used the Research Electronic Data Capture (REDCap) system hosted at our institution.16 Our staff registered patients as REDCap participants, assigned them to their disease-specific study arms, and gave them tablets to use to complete the surveys.
Patients who were randomly assigned to take the surveys on paper were given a packet that included the demographics survey, the EQ-5D, a disease-specific survey, and a satisfaction survey. Their responses were then manually entered by the investigators into the REDCap system.
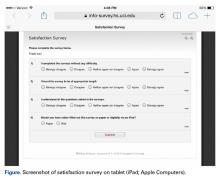
Patients who were randomly assigned to take the surveys on tablets used the REDCap survey feature, which allowed them to directly input their responses into the database (Figure).
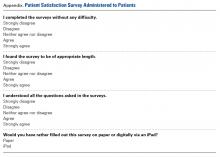
To allow them to skip a question (same as on paper), we did not activate the REDCap “require” feature. Had this feature been used, patients would have had to answer each question before being allowed to proceed to the next one. Similarly, patients could select multiple answers for a single question (as on paper). With these modifications, we attempted to replicate, as much as possible, the experience of taking a survey on paper.Our primary outcome measure was survey completion rate. Secondary outcome measures were total time for completion, number of questions left unanswered on incomplete surveys, patient satisfaction with survey length (Likert scale, 1-5), ease of completion (Likert scale, 1-5), ability to comprehend questions (Likert scale, 1-5), and preference for the other survey modality (Appendix).
We used the findings of Dy and colleagues6 to identify the sample size needed for detecting a significant difference between the tablet and the paper group when using a 2-sided test with a power set to 80%. In their study, 24% of paper surveys and 2% of tablet surveys were unscorable,6 which we used as our predicted incompletion rate.We used SPSS statistical software (IBM) to analyze our data, t test to compare continuous variables, χ2 test to compare categorical variables, and linear regression to test the relationship between number of questions and completion rate. Statistical significance was set at P < .05.


