At the 15-year follow-up, patients were contacted via telephone to obtain their HSS knee scores. If patients were unavailable/unable to answer the questions asked, knee score information was collected from a first-degree relative or caretaker. Patients that could not be contacted by phone were sent a HSS knee score survey to their last known address. The online Social Security Death Index was queried for confirmation of death. If deceased, a first-degree relative was contacted for confirmation.
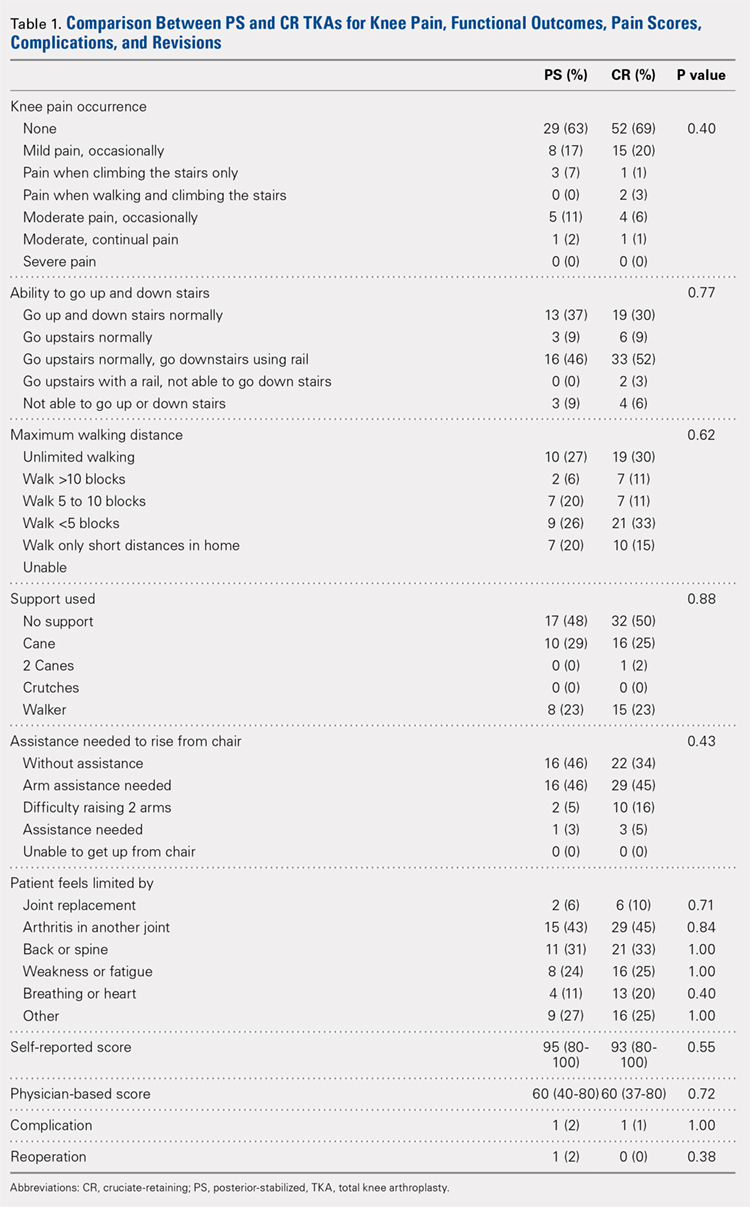
Survivorship was evaluated using revision for any reason and revision for aseptic loosening as separate endpoints via the Kaplan-Meier product-limit method, and the CR and PS TKA groups were compared using the log-rank test. The power of the study for detecting differences between the TKA groups was determined to be 80%, based on a moderate hazard ratio of 1.5, using the log-rank test. Differences between PS and CR TKAs were assessed using the Pearson chi-square test for knee pain and functional outcomes, Fisher’s exact test for patient limitations, such as joint replacement, and the non-parametric Mann Whitney U-test for median pain scores (Table 1). Spearman correlations between the patients’ self-reported knee scores (as a percentage of normal) and physician-based knee scores were performed to assess whether self-reported knee scores were significantly correlated with physician-based knee scores. Kaplan-Meier analysis was performed to evaluate time-related freedom from reoperation at 95% confidence intervals. Statistical analysis was conducted using IBM SPSS Statistics (version 21.0, IBM). Two-tailed P < .05 was considered statistically significant.
RESULTS
Of the 287 patients (334 knees) who had primary TKAs, 99 patients (121 knees; 75 CR and 46 PS) were available at the 15-year follow-up. A total of 155 patients (171 knees) died before the 15-year follow-up, and 33 (42 knees) were lost to follow-up (Figure 1). The functional status of the knees of patients who were lost to follow-up or who had died since the previous follow-up data were published is unknown.
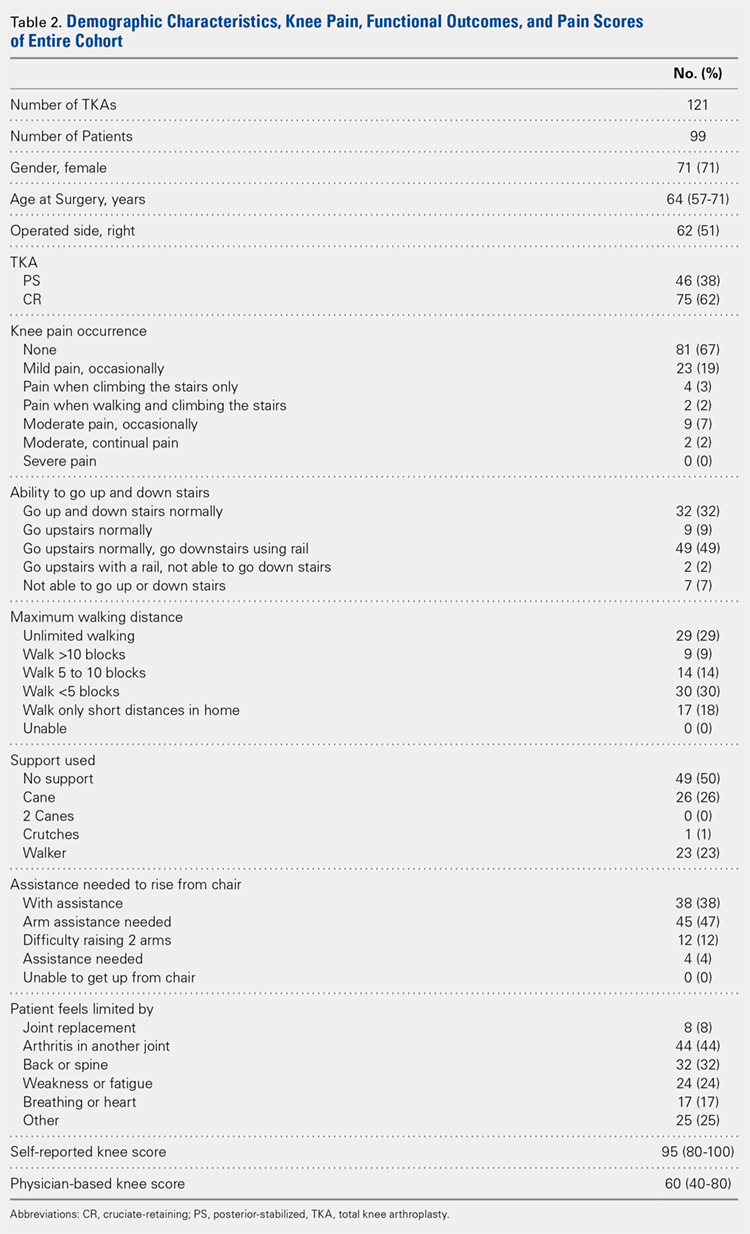
Demographic and outcome data for the cohort of 121 TKAs (99 patients) are summarized in Table 2. The median age at surgery was 64 years, and 71% of the cohort was female.
At the 15-year follow-up, survivorship in both groups was similar: 98% for PS TKAs and 100% for CR TKAs. The 2 groups were also similar functionally: 80% of the PS implants and 89% of the CR implants were associated with no or mild pain (P = .40). Approximately half of the patients in both groups (52% PS; 50% CR; P = .88) required walking support (canes or walkers) and nearly half of both groups (46% PS; 48% CR; P = .62) could walk <5 blocks or only short distances in their homes. In addition, 46% of the patients in both groups reported needing arm assistance to functionally rise from a chair (P = .43); 91% of the patients in both groups could also walk up and down stairs (P = .77). No statistical difference in the medical conditions limiting the patients in the 2 groups was found: joint replacement (2% PS; 6% CR; P = .71), arthritis in another joint (43% PS; 45% CR; P = .84), back or spine arthritis (31% PS; 33% CR; P = 1.00), weakness or fatigue (24% PS; 25% CR; P = 1.00), breathing or heart ailments (11% PS; 20% CR; P = .40), and other reasons (27% PS; 25% CR; P = 1.00). In addition, median self-reported knee scores were 95 and 93 points for the PS and CR groups, respectively (P = .55).
Continue to: Patients reported 2 complications...


