METHODS
The senior author (BRL) and a research team created a 15-question survey to evaluate patient preferences regarding the demographic characteristics (eg, age, gender, ethnicity) of their physician, wait times in a waiting room, time spent with the physician, care received from physician extenders (eg, nurse practitioners, physician assistants), and how they learned of their physician (Appendix). An a priori power analysis was conducted to determine that approximately 200 patients were needed for inclusion.11,22 Following Institutional Review Board approval (ORA 15051104), the survey was administered to 212 patients in a single-surgeon, adult reconstruction clinic. The survey was digitally administered on a touch-screen tablet using an electronic independent third party survey center (SurveyMonkey Inc) devoid of any identifying data. The survey was offered to all patients >21 years of age who were English-speaking and in the common area as patients waiting to be seen, from June 2015 to March 2016. A research assistant approached patients in the waiting room and asked if they would like to participate in a short survey regarding what factors influence the patient-physician relationship from the patient’s perspective.
Appendix 1
- Do you wish to partake in this 3-minute survey?
- Have you had a prior knee or hip replacement?
- What is your age?
- 30-40 years
- 40-50 years
- 50-60 years
- 60-70 years
- 70-80 years
- 80+ years
- What is your gender?
- Which of the following best represents your racial or ethnic heritage?
- African American
- How much time would you like the doctor to spend talking to you on a routine visit?
- 0-5 minutes
- 5-10 minutes
- 10-15 minutes
- 15-20 minutes
- 20-30 minutes
- >30 minutes
- How long is too long to wait to see the doctor?
- 10 minutes
- 20 minutes
- 30 minutes
- 40 minutes
- 50 minutes
- An hour or more
- If you were to only see a physician’s assistant or nurse practitioner at your follow-up visit and not the doctor, would you feel like you were getting below average care?
- Overall I am satisfied with the time the doctor spends with me.
- If you were to need a major surgery, would you want the physician to tell you what he or she would do if they were in your shoes?
- Would you prefer your doctor to be the same race/ethnicity as you?
- No
- No Preference
- Would you feel more comfortable with a male as opposed to a female orthopedic surgeon?
- Would you feel more comfortable with a female as opposed to a male orthopedic surgeon?
- What age would you like your physician to be?
- 25-35 years old
- 35-45 years old
- 45-55 years old
- 55-65 years old
- 65 years and older
- No preference
- How do you usually find your physician?
- Friends’ recommendations
- Healthcare provider’s recommendations
- Insurance plans
- Online research/ratings
- Other
Descriptive statistics were used to analyze subject demographics and survey responses. Chi-square analyses and multinomial logistic regressions were utilized to compare responses. All statistical analyses were conducted using SPSS version 24.0 software (SPSS Inc). Statistical significance was set at P < 0.05.
RESULTS
Of the 212 patients who were invited to participate, 196 patients (92.4%) agreed and completed the survey. Demographic and surgical history information can be found in Table 1. The majority of patients were female (62%) and above the age of 50 years (92.4%). Almost half (48.5%) of patients had a prior hip or knee replacement.
Table 1. Survey Respondent Demographics
Number | Percent | |
Age Range | ||
30-40 years | 4 | 2.0% |
40-50 years | 11 | 5.6% |
50-60 years | 47 | 24.0% |
60-70 years | 84 | 42.9% |
70-80 years | 41 | 20.9% |
>80 years | 9 | 4.6% |
Gender | ||
Male | 74 | 37.8% |
Female | 122 | 62.2% |
Ethnicity | ||
African American | 39 | 19.9% |
Asian | 3 | 1.5% |
Caucasian | 140 | 71.4% |
Hispanic | 10 | 5.1% |
Other | 4 | 2.0% |
Prior knee or hip replacement | ||
Yes | 95 | 48.5% |
No | 55 | 28.1% |
No Response | 46 | 23.5% |
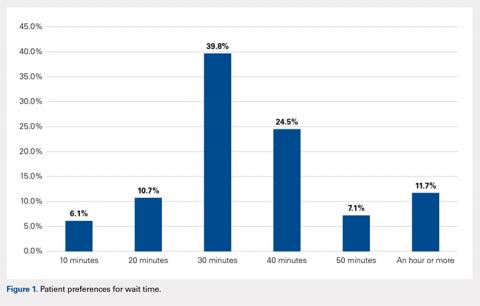
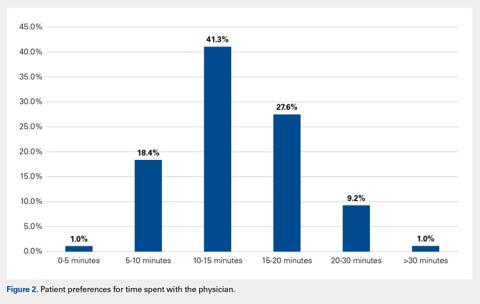
When asked how long is too long to wait to see the doctor, 30 minutes (39.8%) was most commonly selected, followed by 40 minutes (24.5%) (Figure 1). When asked how much time patients would like the doctor to spend with them during an office visit, the majority (68.9%) selected either 10 to 15 minutes (41.3%) or 15 to 20 minutes (27.6%) (Figure 2). The majority of patients (92.3%) were satisfied with the amount of time the doctor spent with them. In addition, 94.9% of respondents would want their doctor to tell them what they would do if they were in the patient’s shoes when making decisions regarding their medical care (Table 2). Less than half of respondents (41.8%) believe that seeing a physician extender (eg, nurse practitioner or physician assistant) at a postoperative visit would result in a lower quality of care (Table 2).
Table 2. Responses to Survey Questions
If you were to only see a physician's assistant or nurse practitioner at your follow-up visit and not the doctor, would you feel like you were getting below average care? | ||
Answer choices | Number | Percent |
No | 114 | 58.2% |
Yes | 82 | 41.8% |
If you were to need a major surgery would you want the physician to tell you what he or she would do if they were in your shoes? | ||
Answer choices | Number | Percent |
No | 10 | 5.1% |
Yes | 186 | 94.9% |
Would you prefer your doctor to be the same race/ethnicity as you? | ||
Answer choices | Number | Percent |
No | 29 | 14.8% |
Yes | 3 | 1.5% |
No Preference | 164 | 83.7% |
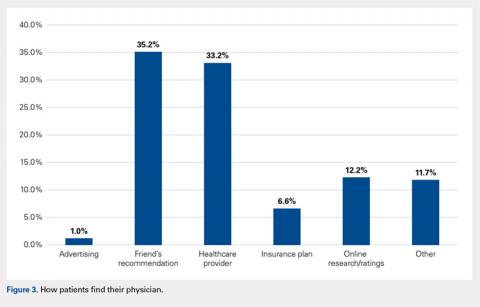
When asked if patients preferred a doctor of the same race/ethnicity, the vast majority (83.7%) had no preference (Table 2). There was no significant difference found between male and female respondents when asked if they would feel more comfortable with a male as opposed to a female orthopedic surgeon (P = .118) and vice versa (P = .604) (Table 3). Most patients preferred a physician between the ages of 45 and 55 years (39.3%), followed by 35 and 45 years (23.0%); however, this preference was not statistically significant (Table 4). Older patients were more likely to prefer younger physicians (odds ratio, 4.612 for 25-35 years of age; odds ratio, 1.328 for 35-45 years of age). Only 12.2% of patients reported online research/rating sites as the main resource utilized when selecting their physician (Figure 3). The majority (68.4%) reported that recommendations from either friends (35.2%) or healthcare providers (33.2%) were the main avenues through which they found their physicians.
Table 3. Overall Responses to Questions Regarding Male and Female Orthopedic Surgeonsa
Would you feel more comfortable with a male as opposed to a female orthopedic surgeon? | |||||
Answer choices | Number | Percent | Female responses | Male responses | P value |
No | 164 | 83.7% | 106 (86.9%) | 58 (78.4%) | 0.118 |
Yes | 32 | 16.3% | 16 (13.1%) | 16 (21.6%) | |
Would you feel more comfortable with a female as opposed to a male orthopedic surgeon? | |||||
Answer choices | Number | Percent | Female responses | Male responses | P value |
No | 186 | 94.9% | 115 (94.3%) | 71 (95.9%) | 0.604 |
Yes | 10 | 5.1% | 7 (5.7%) | 3 (4.1%) | |
aResponses were broken down by gender and compared utilizing a 2 x 2 chi-square analysis to test for significant differences in respondents’ gender preferences for their orthopedic surgeon.
Table 4. Patient Preferences Regarding Physician Age
What age would you like your physician to be? | 95% Confidence Interval | |||||
Answer Choices | Number or Responses | Percent | P value | Exp(β) | Lower Bound | Upper Bound |
25-35 years | 1 | 0.5% | 0.217 | 4.612 | 0.407 | 52.283 |
35-45 years | 45 | 23.0% | 0.161 | 1.328 | 0.893 | 1.975 |
45-55 years | 77 | 39.3% | 0.159 | 1.276 | 0.909 | 1.791 |
55-65 years | 9 | 4.6% | 0.483 | 1.302 | 0.624 | 2.717 |
≥65 years | 2 | 1.0% | 0.272 | 0.491 | 0.138 | 1.748 |
No preferencea | 62 | 31.6% | Reference | |||
aNo preference was used as the reference category for the answer choices, while the age bracket “>80 years” was used as the reference for the age of respondent variable.
Continue to: DISCUSSION...


