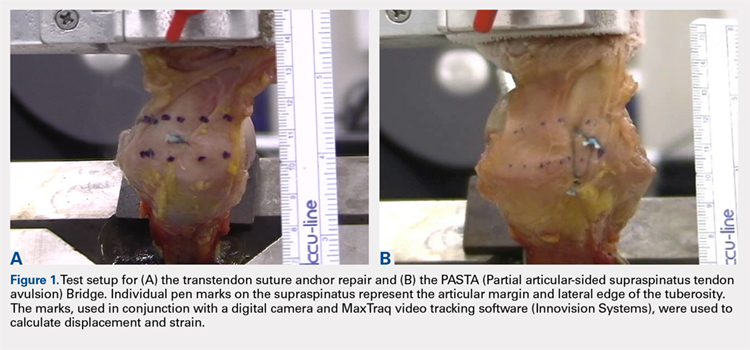
Biomechanical testing was conducted using an INSTRON 8871 Axial Table Top Servo-hydraulic Testing System (INSTRON), with a 5 kN load cell attached to the crosshead. The system was calibrated using FastTrack software (AEC Software), and both the load and position controls were run through WaveMaker software (WaveMaker). Each sample was positioned on a fixed angle fixture and secured to the testing surface so that the direction of pull would be performed 45° to the humeral shaft. A custom fixture with inter-digitated brass clamps was attached to the crosshead, and dry ice was used to freeze the tendon to the clamp. The test setup can be seen in Figures 1A, 1B.
Each sample was pre-loaded to 10 N to remove slack from the system. Pre-loading was followed by cyclic loading between 10 N and 100 N,7-11 at 1 Hz, for 100 cycles. One-hundred cycles were chosen based on literature stating that the majority of the cyclic displacement occurs in the first 100 cycles.7-10 Post cycling, the samples were loaded to failure at a rate of 33 mm/sec.7-12 Load and position data were recorded at 500 Hz, and the mode of failure was noted for each sample.
Before loading, a soft-tissue marker was used to create individual marks on the supraspinatus in-line with the articular margin and lateral edge of the tuberosity (Figures 1A, 1B). The individual marks, a digital camera, and MaxTraq video tracking software (Innovision Systems) were used to calculate displacement and strain.
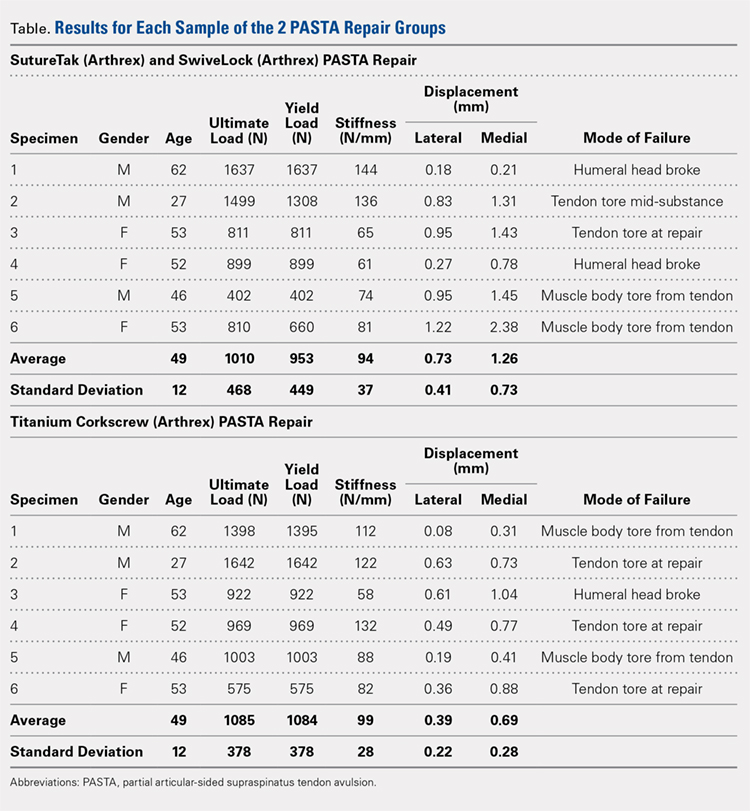
For each sample, the ultimate load, yield load, and stiffness were determined from the load-displacement results. Video tracking software was used to determine the cyclic displacement of each sample at both the articular margin (medial dots) and at the repair site. The strain at these 2 locations was calculated by dividing the cyclic displacement of the respective site by the distance between the site of interest and the lateral edge of the tuberosity (lateral marks) (ΔL/L). Paired t tests (α = 0.05) were used to determine if differences in ultimate load or strain between the 2 repairs were significant.
RESULTS
BIOMECHANICAL ANALYSIS
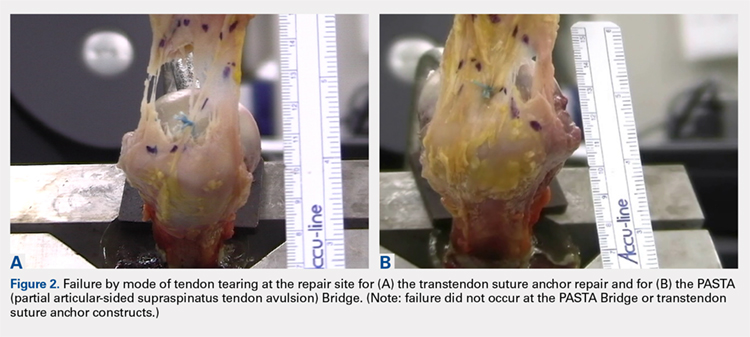
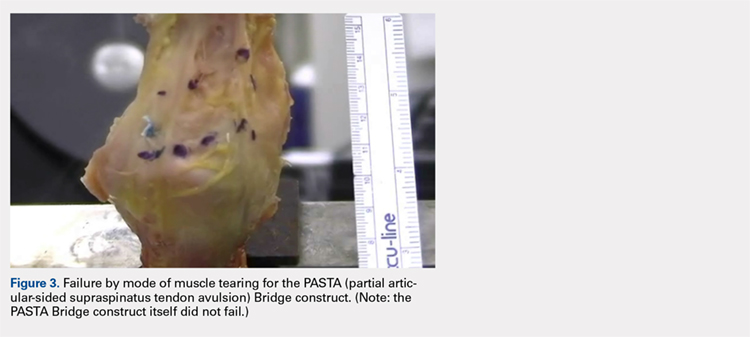
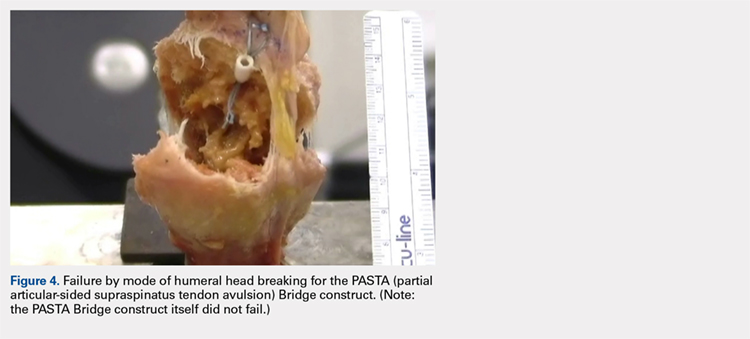
The results of the biomechanical testing are provided in the Table. There were no significant differences between the 2 repairs in ultimate load (P = .577), strain at the repair site (P = .355), or strain at the margin (P = .801). A post-hoc power analysis revealed that a sample size of at least 20 matched pairs would be needed to establish a significant difference for strain at the repair site. The modes of failure were mid-substance tendon tearing, the humeral head breaking, tearing at the musculotendinous junction, or the tendon tearing at the repair site. All 4 modes of failure occurred in at least 1 sample from both repair groups (Figures 2-4). Visual inspection of the samples post-testing revealed no damage to the anchors or sutures. A representative picture of the tendon tearing at the repair site can be seen in Figures 2A, 2B.
Continue to: The purpose of...

