STATISTICAL ANALYSIS
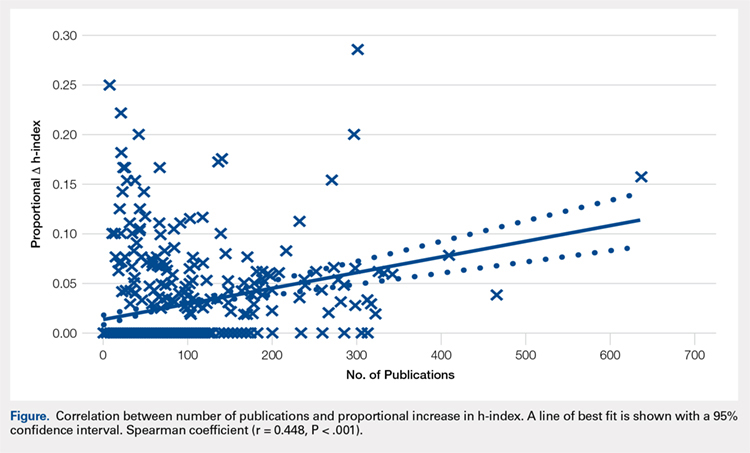
Bibliometric analyses were presented descriptively with means ± standard deviation. After testing for normality, differences in the h-index between groups were assessed via analysis of variance tests. The proportional increase in the number of citations and the h-index were calculated by dividing the difference between the before and after exclusion of self-citations by the total number of citations before exclusion. The relationship between the number of publications and the proportional change in the h-index was assessed via calculation of the Spearman correlation coefficient. The independent variable was the number of publications, and the proportional increase in the h-index via self-citation was the dependent variable. Statistical tests were performed on STATA 13 (StataCorp) and the results considered significant if P < .05. Figures were created using GraphPad Prism 6.02 Software.
RESULTS
A total of 463 orthopedic investigators were included (147 chairpersons, 118 program directors, and 198 NIH-funded faculty) (Table 1). On average, these researchers produced 72.3 ± 83.0 articles and referenced 2139 ± 3222 articles (mean, 29.6 references per article). The cumulative h-index was 19.2 ± 15.6, and was the highest among NIH-funded researchers (24.3 ± 17.0) (P < .001). In all, 83.8% of orthopedic investigators self-cited their previous work at least once, and the total number of self-citations was highest among NIH-funded investigators (221 ± 355) (P < .001). After these self-citations were excluded, the h-index changed by 0.6 ± 1.1 for all investigators, and this change was greatest among NIH-funded researchers (1.1 ± 1.3) (P < .001).
Table 1. Effect of Self-Citation on NIH-funded Investigators, Chairpersons, and Program Directors in Orthopedics
| Investigator | N (%) | Articles, n (mean ± SD) | Total Citations (mean ± SD) | h-index | Self-Citations (mean ± SD) | Corrected h-index | ∆ h-index |
| NIH-funded | 198 (42.8) | 87.6 ± 84.9 | 3086 ± 3799 | 24.3 ± 17.0 | 221 ± 355 | 23.2 ± 16.3 | 1.1 ± 1.3 |
| Chairperson | 147 (31.7) | 85.3 ± 95.5 | 2151 ± 3098 | 19.9 ± 15.0 | 85.2 ± 221 | 19.5 ± 14.5 | 0.4 ± 0.8 |
| Program Director | 118 (25.5) | 30.5 ± 35.9 | 536.8 ± 785 | 9.6 ± 7.2 | 8.8 ± 19.9 | 9.5 ± 7.1 | 0.1 ± 0.3 |
| Total | 463 (100) | 72.3 ± 83.0 | 2139 ± 3222 | 19.2 ± 15.6 | 123.9 ± 277.6 | 18.5 ± 14.9 | 0.6 ± 1.1 |
Abbreviation: NIH, National Institutes of Health.
Most orthopedic investigators did not increase their h-index via self-citation (63.7%, P < .001). Table 2 categorizes investigators by changes in their h-index after excluding self-citations (range, 0-11). The maximal change in the h-index was seen in the most prolific group of investigators, who produced 261.0 ± 149.3 articles. In this group, the h-index increased by 11.1% ± 5.2%. The Figure investigates the relationship between the number of articles and the proportional increase in the h-index. The number of publications was positively correlated with the change in h-index after self-citations were excluded (r = 0.448, P < .001).
Table 2. Stratification of Orthopedic Researcher Investigators by Change in h-index After Self-Citation
∆ h-index | N (%) | Articles (mean ± SD) | Self-Citations (mean ± SD) | h-index (mean ± SD) | % Increase in h-index |
| 0 | 295 (63.7) | 43.8 ± 51.3 | 27.6 ± 58.4 | 13.1 ± 10.7 | 0 |
| 1 | 101 (21.8) | 87.9 ± 68.3 | 126.0 ± 130.6 | 24.0 ± 13.3 | 5.9 ± 4.1 |
| 2 | 42 (9.1) | 141.9 ± 111.1 | 331.6 ± 318.0 | 32.4 ± 16.6 | 8.4 ± 5.5 |
| 3 | 14 (3.0) | 203.1 ± 92.6 | 611.6 ± 332.9 | 45.4 ± 14.9 | 7.6 ± 3.6 |
| 4+ | 11 (2.4) | 261.0 ± 149.3 | 1277.1 ± 692.4 | 53.1 ± 18.9 | 11.1 ± 5.2 |
DISCUSSION
The practice of self-citation is widely prevalent among experienced orthopedic investigators. However, this practice seems to have minimal impact on the h-index for most investigators. Self-citation had a measurable impact on the h-index only after an investigator had many publications. At a mean of 87.9 ± 68.3 articles, investigators had a ∆h-index of 1. This represented a mean 5.9% increase. Overall, these findings underscore the utility of the h-index in assessing scholarly impact and ameliorate concerns over bibliometric manipulation.
Among a large group of experienced orthopedic investigators, self-citation has minimal effect on the h-index. Importantly, most investigators (63.7%) did not experience a full integer increase in their h-index. At a threshold of ∆ h-index increase of 1, investigators had impressive h-indices (24.0 ± 13.3), which eclipsed those of recent studies of hand surgeons (10.2 ± 9.9) and spine surgeons (13.6 ± 8.7).4,5 This finding suggests that committees for academic promotion in orthopedic surgery may disregard the impact of self-citation on the h-index. While the thresholds for promotion have not been defined in the orthopedic literature, a study in plastic surgery established an h-index threshold of 14.5 for promotion from associate to full professor.14 It may be, however, that h-indices are higher among orthopedic surgeons, as a previous study reported an h-index of 20 among full professors.15 Future research is needed to determine thresholds for promotion within orthopedic surgery, as the h-index varies by specialty according to unique citation patterns.
Continue to: It is worth highlighting...

