To investigate the characteristics of surgeons consistently performing TSA, all surgeons performing a minimum of 11 TSA in Medicare fee-for-service beneficiaries in all years between 2012 and 2014 were identified. Such surgeons were defined as consistent TSA surgeons. Investigation of this cohort included a web-based search of their self-reported post-graduate fellowship training and year of graduation from medical school. Using these data, the percentage of surgeons performing TSA who underwent formal shoulder and elbow training was determined. In addition, the impact of fellowship training on shoulder specialization and practice location was determined. Surgeons who had completed multiple fellowships were categorized under all of them. As such, there may be some duplication of surgeons in the comparisons. In addition, other potential characteristics of shoulder and elbow fellowship-trained surgeons were investigated: number of regional shoulder surgeons, urban area, total number of Medicare beneficiaries, average reimbursement for TSA, ethnicity of Medicare beneficiaries, and percentage of Medicare patients eligible for Medicaid. Geographic regions were defined by the Dartmouth Atlas and assigned by hospital referral region.15 These defined regions were used to assess the beneficiaries (number and characteristics) that individual surgeons were likely serving. The United States Census Bureau characterization of zip code-based regions as urban areas (population >50,000), urban clusters (2500 to 50,000), and rural region (<2500) was used to categorize practice location.16
Descriptive statistics were used initially to report these findings. To analyze predictors of utilization and specialization, comparative statistics were undertaken. For comparison of binomial variables between groups, a χ2analysis was utilized. For continuous variables, data normality was assessed. A skewness and kurtosis <2 and 12, respectively, was considered to represent parametric data. For parametric data, the mean was reported; conversely, the median is reported for non-parametric data. To assess continuous variables between groups, a t test or a Wilcoxon rank-sum test was used for parametric and non-parametric distributions, respectively.
RESULTS
Between 2012 and 2014, 1374 surgeons (39 females [2.8%]) performed >10 TSA in Medicare patients in at least 1 year, for a combined total of 71,973 TSAs (Table 1). In 2012, only 834 surgeons (13 females [1.6%]) performed a minimum of 10 TSA in Medicare patients (21,137 arthroplasties; 25.3 per surgeon). This increased to 1078 surgeons (33 females [3.1%]; P = .04) performing 26,865 TSA (24.92 per surgeon) in 2014. Utilization of non-physician assistants in TSA also increased significantly over this period, with 307 assisting in 6885 TSAs (22.4 per provider) in 2012 and 465 assisting 10,433 TSA (22.4 per provider) in 2014. When all procedures were considered, including those performed at outpatient visits, 1319 physicians (95.9% of cohort) were active in 2012—providing either surgical procedures or outpatient consults to the Medicare population. Yet, only 63.2% performed >10 TSA in Medicare patients. The number of active surgeons performing TSA increased to 79.6% (1078/1353) in 2014 (P < .001).
Table 1. Trends in the Number of Providers Performing TSA between 2012 and 2014*
2012 | 2013 | 2014 | Total | |
Providers (no.) | 1141 | 1373 | 1543 | 1994 |
Physicians | 834 | 984 | 1,078 | 1,374 |
Non-physicians | 307 | 389 | 465 | 620 |
TSA (no.) | 28,022 | 32,641 | 37,298 | 97,961 |
Physicians | 21,137 | 23,971 | 26,865 | 71,973 |
Non-physicians | 6,885 | 8,670 | 10,433 | 25,988 |
TSA per provider | 24.5 | 23.8 | 24.2 | 49.2 |
Physicians | 25.3 | 24.3 | 24.9 | 52.4 |
Non-physicians | 22.4 | 22.3 | 22.4 | 41.2 |
Procedures (no.) | 210,845 | 224,123 | 227,305 | 662,273 |
Physicians | 152,862 | 160,114 | 160,851 | 473,827 |
Non-physicians | 57,983 | 64,009 | 66,454 | 188,446 |
Procedure per provider | 114.4 | 116.8 | 116.5 | 332.13 |
Physicians | 115.9 | 118.9 | 118.9 | 344.9 |
Non-physicians | 110.7 | 111.9 | 111.1 | 303.9 |
Active providers (no.) | 1843 | 1919 | 1951 | 1994 |
Physicians | 1319 | 1347 | 1353 | 1374 |
Non-physicians | 524 | 572 | 598 | 620 |
* Included are the number of arthroplasties and total procedures over time among this cohort. The number of active providers, determined by billing Medicare for office or surgical procedures within that year, is reported.
Abbreviation: TSA, total shoulder arthroplasty.
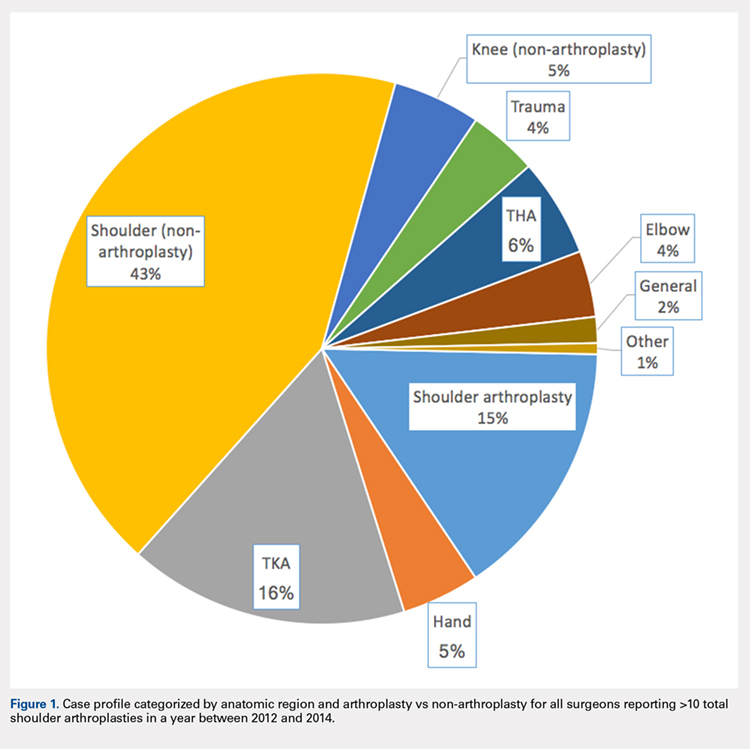
In addition to TSA, this cohort of surgeons submitted 240 unique CPT codes with case volumes >10 annually over the 3-year study period. Of these, 80.2% (1102/1374) of surgeons performed non-arthroplasty shoulder procedures on Medicare patients, for a combined total of 202,335 procedures over the 3-year study period (Table 2). A significant proportion of these procedures were arthroscopic debridement (60,014 procedures performed by 908 surgeons) and arthroscopic rotator cuff repair (47,089 procedures performed by 809 surgeons). Just under half (49.1%; 674/1374) of surgeons performing TSA also performed TKA during this period (77,873 arthroplasties). Fewer surgeons (27.8%; 382/1374) performed total hip arthroplasty during this period (27,322 arthroplasties). Other procedure types that this group of surgeons routinely performed on Medicare patients were repairs of traumatic injuries (29.8%), non-arthroplasty knee surgeries (27.2%), elbow procedures (19.6%), and hand surgery (15.4%). By case load, non-arthroplasty shoulder procedures consisted of 43% of Medicare volume over the study period (Figure 1). Between 2012 and 2014, the average proportion of Medicare cases that were shoulder arthroplasties increased from 13.8% (21,137/152,862) to 16.7% (26,865/160,851; P = .001). Shoulder arthroplasty constituted 100% of the Medicare surgical case volume for 67 (4.9%; 67/1374) of the surgeons.
Table 2. Case Volumes over Time with All Procedures Categorized by Anatomic Region and Arthroplasty vs Non-arthroplasty*
2012 | 2013 | 2014 | Total | |
Shoulder arthroplasty | 21,351 (n=837) | 24,128 (n=984) | 26,902 (n=1,078) | 72,381 (n=1,374) |
23472: total shoulder arthroplasty | 21,137 (n=834) | 23,971 (n=984) | 26,865 (n=1,078) | 71,973 (n=1,374) |
23470: Hemiarthroplasty | 214 (n=14) | 84 (n=6) | 37 (n=2) | 335 (n=15) |
Shoulder (non-arthroplasty) | 65,947 (n=887) | 68,746 (n=942) | 67,642 (n=932) | 202,335 (n=1,102) |
29826: arthroscopic acromioplasty | 19,152 (n=724) | 20,367 (n=760) | 20,495 (n=754) | 60,014 (n=908) |
29827: arthroscopic rotator cuff repair | 14,700 (n=613) | 15,963 (n=664) | 16,426 (n=658) | 47,089 (n=809) |
23412: open rotator cuff repair | 1957 (n=88) | 2046 (n=90) | 2112 (n=2,112) | 6115 (n=143) |
23430: Open biceps tenodesis | 4063 (n=178) | 3998 (n=167) | 4601 (n=185) | 12,662 (n=288) |
29823: arthroscopic major debridement | 7428 (n=301) | 7745 (n=309) | 5202 (n=210) | 20,375 (n=417) |
Total knee arthroplasty | 25,640 (n=565) | 26,558 (n=587) | 25,675 (n=580) | 77,873 (n=637) |
Total hip arthroplasty | 8729 (n=316) | 9226 (n=318) | 9367 (n=330) | 27,322 (n=382) |
Trauma | 6454 (n=260) | 6396 (n=254) | 6364 (n=261) | 19,214 (n=410) |
27245: surgical treatment of broken thigh bone (intertrochanteric) | 2602 (n=162) | 2654 (n=164) | 2537 (n=160) | 7793 (n=274) |
27236: surgical treatment of broken thigh bone (hemiarthroplasty) | 1961 (n=123) | 1703 (n=111) | 1702 (n=112) | 5366 (n=205) |
Hand | 6343 (n=139) | 7321 (n=154) | 8006 (n=172) | 21,670 (n=211) |
Elbow | 6113 (n=198) | 6139 (n=204) | 6131 (n=198) | 18,383 (n=270) |
Knee (non-arthroplasty) | 8514 (n=275) | 8140 (n=275) | 7689 (n=230) | 24,343 (n=374) |
Outpatient visits | 879,740 (n=1,282) | 907,124 (n=1,320) | 921,291 (n=1,327) | 2,708,155 (n=1,342) |
New patient | 195,898 (n=1,276) | 192,937 (n=1,305) | 191,427 (n=1,315) | 571,203 (n=1,332) |
Existing patient | 740,307 (n=1,279) | 714,187 (n=1,316) | 729,864 (n=1,324) | 2,29,976 (n=1,338) |
* Procedures of interest with high case volumes are reported individually.
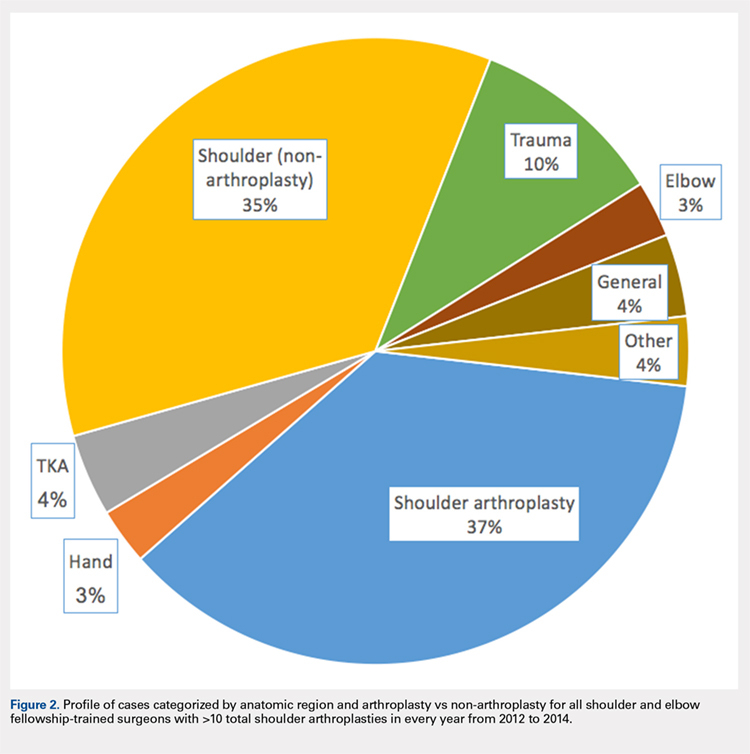
Only 44.3% (609/1374) of surgeons performed TSA in a minimum of 11 Medicare patients in all 3 years of the study period (consistent providers of TSA), providing a total of 55,538 TSA (77.2%; 55,538/71,973). When fellowship training was evaluated, 191 (31.4%; 191/609) of these surgeons were shoulder and elbow fellowship trained (21,444 TSA; 38.6%; Table 3). More than one-third (36.6%; 223/609) had completed a sports surgery fellowship (18,899 TSA; 34.0%). Surgeons trained in hand surgery (12.5%; 76/609) and adult reconstruction (5.3%; 32/610) also made contributions to meeting the TSA demand with 6971 (12.6%) and 2485 (4.5%) TSA, respectively. One-fifth of this cohort (18.1%; 110/609) had unknown fellowship training: they either reported no fellowship (13.6%; 83/609) or did not specify the type of training (4.4%; 27/609). Shoulder and elbow fellowship-trained surgeons performed more TSA (median: 89.0 TSA per surgeon between 2012 and 2014) than surgeons without shoulder and elbow fellowship training (median: 67.0 TSA per surgeon; P < 0.001). More than one-third (37%) of shoulder and elbow fellowship-trained surgeons’ surgical case volume was comprised of TSA, with an additional 35% from non-arthroplasty shoulder procedures (Figure 2). In order for the current supply of shoulder and elbow fellowship-trained surgeons to meet the Medicare TSA demand, each fellowship graduate would have to perform 140.6 TSA in Medicare patients annually. Shoulder and elbow fellowship-trained surgeons were more likely to practice in referral regions with an increased Medicare population (P < .001), an increased number of surgeons performing TSA (P < .001), and a higher proportion of Medicaid-eligible patients (P = .01; Table 4). Shoulder and elbow fellowship-trained surgeons (18.7 years post-medical school graduation) were also earlier in their careers than other consistent TSA surgeons (23.1 years post-graduation; P < .001).
Table 3. A Representation of Fellowships Among TSA Surgeons and Their Shoulder Arthroplasty Case Load*
Fellowship | Surgeons (%) | 2012-2014 (no, %) | SA Medicare Cases (%) | Average Surgeon Annual SA Volume |
Shoulder and elbow | 191 (31.4%) | 21,444 (38.6%) | 29.3% | 37.4 |
Hand surgery | 76 (12.5%) | 6971 (12.6%) | 17.1% | 30.6 |
Sports | 223 (36.6%) | 18,899 (34.0%) | 19.4% | 28.3 |
Trauma | 14 (2.3%) | 1270 (2.3%) | 10.9% | 30.2 |
Adult reconstruction | 32 (5.3%) | 2485 (4.5%) | 10.2% | 25.9 |
Unknown/none | 110 (18.1%) | 8489 (15.3%) | 16.3% | 25.7 |
1 Fellowship | 459 (75.3%) | 42,065 (75.7%) | 20.7% | 30.5 |
≥2 Fellowships | 67 (11.0%) | 7122 (12.8%) | 22.5% | 35.4 |
* Not all fellowships (eg, oncology) included due to small numbers. Also, many surgeons performed multiple fellowships.
Abbreviations: SA, shoulder arthroplasty; TSA, total shoulder arthroplasty.
Table 4. Breakdown of Geographic Characteristics of Orthopedic Surgeons Consistently
Performing TSA between 2012 and 2014 Stratified by Fellowship Training
Abbreviations: HRR, hospital referral region; TSA, total shoulder arthroplasty.
Fellowship | Percentage in Non-Urban Area | Average No. of Other TSA Surgeons within HRR | Median Proportion of Patients Eligible for Medicaid within HRR | Average Proportion of Caucasian Patients within HRR | Average Population in Practicing Zip Code | Average No. of Medicare Beneficiaries in HRR | Average No. Years from Medical School Graduation |
Shoulder and elbow | 7.3% | 10.5 | 12.6 | 84.7 | 26,620.1 | 224,868.3 | 18.7 |
Other fellowships | 10.3% | 8.6 | 11.1 | 85.6 | 27,619.7 | 177,939.7 | 23.1 |
P value | 0.29 | <0.001 | 0.01 | 0.30 | 0.41 | <0.001 | <0.001 |
Hand surgery | 7.9% | 8.1 | 12.8 | 83.7 | 24,022.8 | 179,370.8 | 23.9 |
Sports | 11.2% | 8.9 | 11.9 | 85.6 | 28,588.9 | 185,902.4 | 21.2 |
Trauma | 21.4% | 7.7 | 13.8 | 85.5 | 20,065.9 | 170,807.6 | 25.6 |
Adult reconstruction | 6.3% | 8.7 | 12.8 | 86.9 | 26,601.5 | 173,280.1 | 22.4 |
None/unknown | 10.9% | 8.5 | 12.0 | 86.4 | 28,173.6 | 166,522.5 | 27.0 |
Continue to: DISCUSSION...


