Screening Measures
A complete metabolic panel and prealbumin levels were assessed at baseline and used as indicators of overall electrolyte, hydration, and nutritional status. A complete blood count and thyroid stimulating test were used to rule out anemia, infections, and thyroid disorders. Because rapid weight loss may precipitate serious ventricular arrhythmias, an electrocardiogram was performed at baseline and after each 50 pounds of weight loss.
Intervention
Subjects consumed 5 Optifast packets per day (each mixed with 6-10 ounces of water), providing 800 calories per day (34% protein, 49% carbohydrate, and 17% fat; with 100% of the Dietary Reference Intake for vitamins and minerals). Participants were enrolled in the program for a minimum of 6 weeks and a maximum of 16 weeks.
The research dietitian provided participants with weekly modules focused on lifestyle and education plans developed by Nestlé (eTable 1). Concentrating initially on behavior modification techniques and later introducing concepts dealing with food minimized distracting stimuli for participants. Subjects were required to consume an additional 2 quarts of noncaloric liquid to maintain hydration and were educated not to consume any liquids or solids containing calories. Subjects were required to maintain a diary on timing of Optifast and fluid consumption. Caffeine intake was limited (< 200 mg per day) because of its effects on fluid loss, cardiac stimulation, and irritation to the gastric mucosa. Participants served as their own controls.
Three weeks prior to completing the liquid diet, patients were instructed on a 3-week dietary transition plan, incorporating solid foods into their meal plan. Transition guidelines used the plate method, based on recommendations from the Dietary Guidelines for Americans to assist individuals in making healthy food choices, as patients were transitioned from the liquid to solid food.24 During transition week 1, subjects consumed 4 shakes per day and 1 meal (885 kcal per day); the second transition week consisted of 3 shakes and 2 meals (1,030 kcal per day); and the final transition week included 1 shake and 3 meals (1,080 kcal per day).
Outcome Measurements
Subjects were weighed weekly. To assess dietary compliance, participants were given a log to record daily intake of the liquid diet, additional liquids consumed, and physical activity. Bioelectrical impedance analysis was used pre- and postintervention to determine body composition, including body fat percentile.
Biochemical outcome measures affected by very low calorie diets (lipids, hemoglobin A1c, fasting glucose) were measured at baseline and every 4 weeks, and clinical outcomes were measured weekly. A BodyGem hand-held indirect calorimeter measured resting energy expenditure (REE) to monitor caloric needs during weight loss and to guide the transition to solid food. Medication use related to obesity was recorded weekly, and the total medication costs were calculated pre- and postintervention.
Medication Management
Blood pressure was monitored weekly. If a patient was prescribed warfarin, the primary care provider and pharmacist were alerted, because it was anticipated that dosages would change with weight loss. Patients on insulin had a 50% reduction on week 1, and subsequent adjustments were made at the discretion of the provider based on glucose monitoring. Oral hypoglycemic agent adjustments were also made based on glucose monitoring.
All patients were prescribed ursodeoxycholic acid 300 mg twice a day to reduce the risk of gallstone formation.25 Psyllium was provided to prevent constipation, a commonly reported adverse event (AE) of Optifast. Over-the-counter lactase additives were recommended for patients with known lactose intolerance. As recommended by the Optifast program, patients were instructed to avoid nonsteroidal anti-inflammatory drugs, aspirin and laxatives, amphetamines/stimulants, pseudoephedrine, and sugar-containing medications. Medications were adjusted according to clinical practices.
Statistical Analysis
Distributions of continuous measurements at the beginning (baseline) and end (follow-up) of the study and changes in these measurements (follow-up minus baseline) were tested for normality using the Shapiro-Wilk test. Where both baseline and follow-up values of a given measurement were distributed normally, both baseline and follow-up values are shown as mean ± SD (Table 1). If ≥ 1 baseline and follow-up measurements were not normally distributed, both baseline and follow-up measurements are shown as median with interquartile range. Changes in measurements are either shown as mean ± SD or median and interquartile range as appropriate. Significance of the former changes was evaluated with a paired t test; whereas the latter changes were evaluated with a Wilcoxon signed rank test.
Results
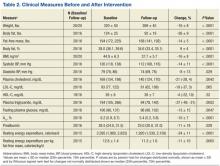
A total of 65 veterans were referred to the program. Eighteen male and 2 female veterans ranging from ages 43 to 68 years, with a mean age of 55 years (SD ± 7.9) consented to participate; 16 (80%) completed the study. Four subjects dropped out; 1 due to lactose intolerance uncontrolled by lactase, 1 due to exacerbation of obsessive compulsive disorder, 1 moved out of state, and 1 opted out before beginning the dietary intervention. Comorbidities included psychiatric diagnoses (80%), hypertension (80%), diabetes (60%), and hyperlipidemia (60%). Baseline characteristics were not different between those who withdrew and those who completed the study (Table 1). Study outcomes based on intent-to-treat analysis are presented in Table 2.


