Statistical Analysis
We examined outcomes with descriptive statistics for each of the candidate covariates in the model classified by femoroacetabular subtype: focal pincer and cam (mixed FAI) and dysplasia with cam. We examined the variables of sex, age, weight, height, body mass index, preoperative NAHS, presence of dysplasia (yes/no), presence of osteoarthritis (yes/no), Tönnis osteoarthritis grade, Outerbridge class, American Society of Anesthesiologists (ASA) score, months of pain, bilateral procedure (yes/no), and pincer involvement with cam FAI (yes/no). Before beginning linear regression modeling, we screened the candidate variables for strong correlations with other variables and looked for those variables with minimal missing data. For all these covariates, we then performed linear regression with a selection process—both a stepwise selection method and a backward elimination method—to verify we determined the same model for 24-month NAHS, or to understand why we could not. Finally, we ran the model we found from the linear regression as a linear mixed model of 24-month NAHS with the dichotomous variables taken as fixed effects and the other variables taken as random effects, using variance-components representation for the random effects. We then examined 3-month and 12-month NAHS with the same variables selected for the 24-month model.
To further examine and verify the effects of dysplasia on outcomes found in our linear mixed model, we performed a nested case–control analysis matching each member of cohort D (cases) with 2 members of cohort M (controls). We used an optimal-matching algorithm to match focal patients in the linear regression dataset with dysplasia patients in the linear regression dataset in such a way as to minimize the overall differences between the datasets. We matched cases and controls on preoperative NAHS, age, sex, presence of osteoarthritis, months of pain, ASA score, and body mass index. The differences between the matched cases and controls (control value minus case value) were compared using Wilcoxon rank sum tests for statistical significance of differences from 0 (with differences generated for each control group member, 2 differences per case) to examine the quality of the match. Finally, we examined the statistical significance of the difference of the outcome variables (3-, 12-, and 24-month NAHS) from 0, again using Wilcoxon rank sum tests. Statistical significance was set at P < .05 using SAS Version 9.3 (SAS Institute).
Surgical Procedure
In all cases, supine outpatient hip arthroscopy was performed under general anesthesia. Anterolateral and modified midanterior portals16 were used. T-capsulotomies were performed in both cohorts. Cohort M underwent anterosuperior acetabuloplasty with a motorized burr. Labral refixation or selective débridement was performed in cohort M, whereas labral repair (with limited freshening of acetabular rim attachment site) or selective débridement (but no segmental resection) was performed in cohort D. Arthroscopic femoroplasty was performed with similar endpoints of 120° minimum hip flexion and 30° minimum flexed hip internal rotation with retention of the labral fluid seal. Capsular repair or plication was not performed for either cohort during the study period.
The cohorts underwent similar postoperative protocols: 2 weeks of protected ambulation using 2 crutches, exercise cycling without resistance beginning postoperative day 1, swimming at 2 weeks, elliptical machine workouts at 6 weeks, jogging at 12 weeks, and return to unrestricted athletics at 5 months.
Results
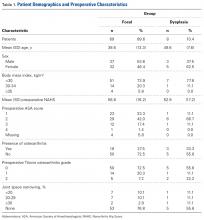
In cohort D, which consisted of 8 patients (5 female), mean age was 49.6 years, and mean LCEA was 19° (range, 16°-24°).
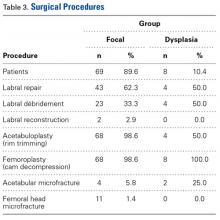
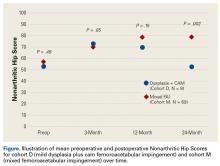
In cohort M, which consisted of 69 patients (32 female), mean age was 38.6 years, and mean LCEA was 33° (range, 25°-38°). Demographics, preoperative variables, intraoperative findings, and surgical procedures are listed in Tables 1 to 3.In cohort D, mean (SD) change in NAHS was +20.00 (6.24) (P = .25) at 3 months (n = 3), +14.33 (9.77) (P = .03) at 12 months (n = 6), and –0.75 (19.86) (P = .74) at 24 months (n = 8).
On the 5-point Likert scale, mean satisfaction was 2.88 (5 = highly satisfied). There were no complications, no revision surgeries, and 2 conversion arthroplasties (25%). Table 4 lists mean preoperative and postoperative NAHS for both cohorts for the regression analysis.In cohort M, mean (SD) change in NAHS was +12.09 (18.98) (P < .0001) at 3 months (n = 45), +20.39 (16.49) (P < .0001) at 12 months (n = 57), and +21.99 (17.32) (P < .0001) at 24 months (n = 69).
Mean satisfaction was 3.58. There was 1 minor complication of transient pudendal neuropraxia (1.4%), 1 revision FAI surgery (1.4%), and 7 conversion arthroplasties (10.1%). Comparative preoperative NAHS and postoperative NAHS are shown in the Figure.In a pairwise case–control comparison, the mean (SD) change-from-baseline difference between cohorts D and M was +8.2 (12.85) (P = .31) at 3 months (n = 5), –8.7 (11.52) (P = .03) at 12 months (n = 10), and –31.06 (23.55) (P = .0002) at 24 months (n = 16). Dysplasia had an impact of –23.4 points on 24-month NAHS (standard error = 5.35 points; P < .0001), which corresponds to a 95% confidence interval of –12.9 to –33.9 points on NAHS.
Table 5 lists mean preoperative and postoperative NAHS for both cohorts for the nested case–control analysis.Compared with cohort M, cohort D had significantly less NAHS improvement (P = .002), less satisfaction (P = .15) and more hip arthroplasty conversions (P = .22, not statistically significant).
There were no statistically significant differences between cohorts in demographics, preoperative variables, intraoperative findings, or surgical procedures in the regression analysis. Of the investigated variables, only group membership (cohort D) was a statistically significant predictor of poorer outcomes in the model of change from preoperative to 24 months. However, older age was associated with cohort D (older patients with dysplasia, P = .07), and therefore in the nested case–control analysis we were able to match on all variables except age (8.74 years older in cohort D, P = .0013) to a level of statistical nonsignificance.


