As expected, tape strip 1 from each participant contained the highest concentration of fluocinonide. This strip corresponded to the most superficial layer of skin. Concentrations decreased in deeper skin layers, as detected in strips 2 to 6.
In general, the average concentration of fluocin-onide in strip 1 for all 5 participants was highest at hour 1, with a subsequent decline at hours 3, 6, and 9; however, participant 1 showed a second peak in fluocinonide concentration at hour 6 (Figure 1). When the fluocinonide concentration in strips 1 to 6 was averaged for each participant at each time point, similar results were obtained: a general decline after hour 1, but a second prominent peak at hour 6 in participant 1 only. In participant 1, the average fluocinonide concentration for strips 1 to 6 was 393 ng/mL at hour 1 and declined to 208 ng/mL at hour 3; it increased to 451 ng/mL at hour 6 before declining again to 202 ng/mL at hour 9.
Figure 1. Fluocinonide concentration in tape strip 1 for all participants (N=5).
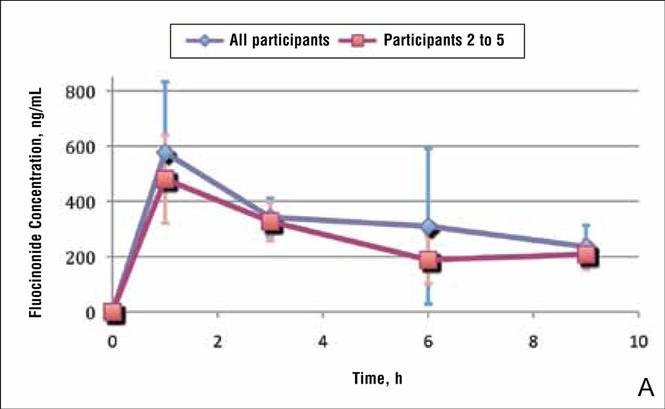
Because participant 1 was the only one to exhibit a second peak of fluocinonide concentration, it appears that measurements obtained from this participant may be outliers. When removing partici-pant 1 from the analysis of fluocinonide concentration in strip 1 at each time point, a clear decline is evident from hour 1 to hour 9 (Figure 2A, red line [partici-pants 2–5] vs blue line [participants 1–5]).
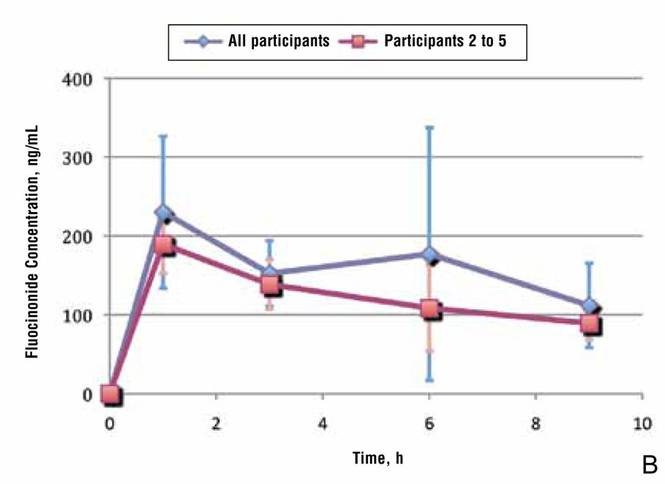
When the average concentration of fluocinonide was calculated in strips 1 to 6 from all participants, there was a general steady decline after hour 1 with a slight increase of 25 ng/mL at hour 6 (Figure 2B, blue line). This increase is due to the measurements obtained from participant 1; however, if partici-pant 1 is removed from the analysis, a constant decline is observed from hour 1 to hour 9 (Figure 2B, red line).
Figure 2. Average fluocinonide concentration in tape strip 1 only (A) and strips 1 to 6 (B)(N=5). Error bars indicate standard deviation.
A prior study evaluated the penetration and absorption of halcinonide in the stratum corneum.7 In summary, halcinonide concentration peaked at hour 1 following application and remained elevated to hour 6, before beginning a slow decline. The average concentration of halcinonide from all participants in strips 1 to 6 reached 1350 ng/mL at hour 1, remained within 93% to 97% of this level (1253–1303 ng/mL) for the next 5 hours, and declined only 29% from the peak at hour 1 to hour 9 (958 ng/mL)(Figure 3, blue line).7 In contrast, the fluocinonide concentration in participants 2 to 5 from the current study reached 190 ng/mL at hour 1 and steadily declined 53% to 89 ng/mL by hour 9 (Figure 3, red line).
Figure 3. Average halcinonide and fluocinonide concentrations in tape strips 1 to 6 (N=5 for both). Adapted from Draelos.7 7
Figure 3. Average halcinonide and fluocinonide concentrations in tape strips 1 to 6 (N=5 for both). Adapted from Draelos.7
Two participants from the prior halcinonide study also were enrolled in the current fluocinonide study (referred to as participant A and B). In general, halcinonide levels in both participants remained elevated for 6 hours after application and declined 27.5% and 35.5%, respectively, by hour 9 (Figure 4). Participant A experienced a 20.5% dip in halcinonide concentration at hour 3 followed by an increase at hour 6; however, the halcinonide concentration at hour 9 was similar to hour 3.7 In contrast, fluocin-onide concentrations for these participants peaked at 1 hour and clearly declined approximately 60% over the next 8 hours.
Figure 4. Fluocinonide and halcin-onide concentrations in tape strips 1 to 6 for 2 participants who received both corticosteroids during different study periods (referred to as participant A and B).
.")
. Adapted from Draelos.7")
.")