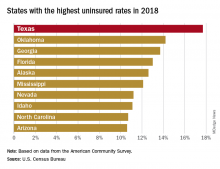
There were just over 5 million uninsured people in the Lone Star State last year, representing an increase from 17.3% of the total population in 2017 to 17.7%, and that works out to an additional 186,000 residents with no health care coverage, the Census Bureau said in a recent report.
That 17.7% rate for 2018 gave Texas the highest proportion of uninsured population, putting it ahead of Oklahoma (14.2%), Georgia (13.7%), Florida (13.0%), Alaska (12.6%), and Mississippi (12.1%). Oklahoma had basically no change from 2017, while the other three each had a small but nonsignificant increase. Nationally, the rate of uninsured population went from 7.9% in 2017 to 8.5% in 2018, the Census Bureau investigators said.
On the other end of the coverage spectrum was Massachusetts, where only 2.8% of the population, or about 189,000 people, lacked health insurance in 2018. Washington, D.C., was next with an uninsured rate of 3.2%, followed by Vermont (4.0%), Hawaii (4.1%), Rhode Island (4.1%), and Minnesota (4.4%), they said, based on data from the American Community Survey.
A separate analysis of Census Bureau data by the personal finance website WalletHub showed that states that expanded Medicaid along with their Affordable Care Act implementation had an average uninsured rate of 7.0% in 2018, compared with 11.1% for states that did not expand eligibility.
All 50 states were in negative territory when changes in uninsured rates were calculated over a longer time period, 2010-2018, as the national rate fell by 6.6%. The largest drops among the states came in Nevada (–11.4%), California (–11.3%), Oregon (–10.1%), and New Mexico (–10.1%), while Massachusetts (–1.7%), Maine (–2.1%), and North Dakota (–2.5%) had the smallest declines, WalletHub reported.


