TABLE 1
Baseline characteristics of patients in the intervention and control groups
| Intervention n=71 | Control n=72 | P1 | |
|---|---|---|---|
| Sex (%) | |||
| Male | 24 | 29 | 0.48 |
| Female | 76 | 71 | |
| Age (years) | 58.5±7.1 | 58.2±6.9 | 0.83 |
| Disorder (%) | |||
| Hypertension | 94 | 89 | 0.34 |
| Diabetes mellitus II | 6 | 7 | |
| Hypertension & diabetes mellitus II | 0 | 4 | |
| Marital status (%) | |||
| Single | 6 | 3 | 0.83 |
| Married/cohabiting | 82 | 86 | |
| Divorced | 1 | 1 | |
| Widowed | 11 | 10 | |
| Education (%)2 | |||
| Low | 68 | 68 | 0.91 |
| Intermediate | 20 | 18 | |
| High | 13 | 15 | |
| Family history of heart disease (%)3 | 27 | 22 | 0.81 |
| Smoking (%)4 | |||
| Not smoking | 79 | 78 | 0.70 |
| Light smoker | 13 | 10 | |
| Heavy smoker | 9 | 13 | |
| Exercise, more than 20 minutes | |||
| No exercise | 20 | 13 | 0.42 |
| Less than 3 times a week | 37 | 30 | |
| 3 times a week | 18 | 26 | |
| More than 3 times a week | 25 | 31 | |
| 1Two-sided P values for differences in baseline characteristics between intervention and control groups. | |||
| 2Low: primary school, lower level of secondary school, lower vocational training. Intermediate: higher level of secondary school, intermediate vocational training. High: higher vocational training, university. | |||
| 3First-degree relatives younger than 60 years. | |||
| 4Light smoker: 0-10 cigarettes a day, or smoking pipe or cigars. Heavy smoker: > 10 cigarettes a day. | |||
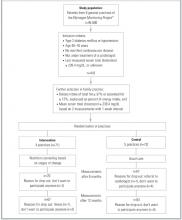
FIGURE 1
Selection and flow of participants
Measurements
Specially trained practice assistants measured anthropometry data, and presented patients with a self-administered questionnaire on demographics, medical history, food frequency, and a stages-of-change algorithm at baseline, 6 months, and 12 months. Blood samples were taken at baseline and at 12 months.
Physical assessment. Anthropometry consisted of body weight to the nearest 0.5 kg, height, and waist and hip circumferences to the nearest 0.5 cm. Patients wore no shoes and only light clothing when weighed. Fasting blood samples were taken twice per measurement period at a 1-week interval, with the patient in the sitting position. The samples were stored at -80°C. Lipids were analyzed enzymatically for total cholesterol,16 HDL cholesterol,17 LDL cholesterol, and triglycerides18 with the Cobas Intergra 700 (Roche Diagnostics, Switzerland), at the laboratory of the Canisius Wilhelmina Hospital (Nijmegen, The Netherlands). The coefficient of variation within runs was 2.3% for total cholesterol, 1.6% for HDL cholesterol, and 1.8% for triglycerides. The LDL cholesterol level was calculated using the equation of Friedewald et al.19
Questionnaires. The questionnaire asked for demographic data, family history of heart disease, smoking status, physical activity, drug use, and diet history at baseline. At follow-up we checked for changes in smoking status, physical activity, and drug use. Patients in the control group were asked if they had visited a dietician during the study period. The intake of energy, total fat, fatty acids, and cholesterol during the preceding 4 weeks was assessed by asking patients to fill out a food frequency questionnaire that included 104 food items. The questionnaire was validated20 and recently revised according to the Dutch National Food Survey 1992.21 Dieticians carried out nutrient calculations with a computerized version of the Dutch food composition tables22 phoned patients in cases of inconsistency.
Stages of change for reduction of fat intake were assessed with a 4-item algorithm based on measures used in previous studies23,23 in combination with the results of the food frequency questionnaire. According to the algorithm, participants were judged to be in precontemplation if they did not consider their diet to be low in fat, they were not in the process of cutting down on fat, and they had no intention of reducing their fat consumption. Participants were considered to be in the contemplation phase if they intended to decrease their fat intake within 6 months but not within 30 days, and to be in preparation when they intended to decrease their fat intake within 30 days. Participants who reported they were currently trying to eat less fat were classified as in action, and participants who reported they had been eating less fat for at least 6 months were classified in maintenance. If participants in maintenance consumed 37% total fat or 12% saturated fat expressed as percent of energy intake, they were reclassified in precontemplation.
After completing the study, all patients filled in an evaluation questionnaire. Patients in the control group were also asked about which nutrition information they had received during the last year.
Intervention
The intervention consisted of nutrition counseling based on stages of change, directed by the FP with selective referral to a dietician. FPs were supported by a protocol that included Prochaska’s8 processes of change. Preparation and action stages were considered 1 stage (action stage) in this study, given the required nutrition education. (Figure 2) summarizes the intervention procedure: 1) counseling aimed at raising consciousness about dietary behavior in the precontemplation stage, 2) motivation to change dietary behavior in the contemplation stage, and 3) if a patient decided to change (action stage), information about practical aspects of dietary change and discussion of referral to a dietician. The intervention was conducted by the patient’s own FP. All patients were referred to the same dietician. Protocols for the FPs and the dietician had been developed and tested prior to the study and were discussed by FPs and the dietician in pre-study group sessions.


