Receiver-operating characteristic (ROC) curves were developed to assess the quality of radar. In medicine, ROC curves are a way to analyze the accuracy of diagnostic tests and to determine the best threshold or “cutoff” value for distinguishing between positive and negative test results.
Diagnostic testing is almost always a tradeoff between sensitivity and specificity. ROC curves provide a graphic representation of this tradeoff. Setting a cutoff value too low may yield a very high sensitivity (ie, no disease would be missed) but at the expense of specificity (ie, a lot of false-positive results). Setting a cutoff too high would yield high specificity at the expense of sensitivity.
Consider a study by Smith et al,1 who measured the accuracy of B-type natriuretic peptide (BNP) as a test for impaired left ventricular function. They measured BNP levels in 155 elderly patients, who also underwent echocardiography (the diagnostic gold standard). An ROC curve was created by plotting the sensitivity against 1–specificity for different cutoff values of BNP (Figure). For example, the sensitivity and specificity of the BNP test were calculated and plotted, assuming a level of 19.8 pmol/L as a cutoff for a positive test.
The best cutoff has the highest sensitivity and lowest 1–specificity, and is therefore located as high up on the vertical axis and as far left on the horizontal axis as possible (upper left corner). The area under an ROC curve is a measure of the usefulness or “discriminative ” value of a test in general. The greater the area, the more useful the test. The maximum possible area under the curve is simply a perfect square and has an area of 1.0. Smith et al’s1 curve has an area of 0.85. The diagonal 45° line represents a test that has no discriminative value—ie, it’s completely useless.
FIGURE 1
Sample ROC curve
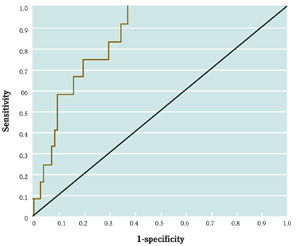
An ROC curve for the accuracy of B-type natriuretic peptide (BNP) as a test for impaired left ventricular function, which plots the sensitivity against 1–specificity for different cutoff values of BNP.
Correspondence
Goutham Rao, MD, 3518 Fifth Avenue, Pittsburgh, PA 15261. E-mail: raog@msx.upmc.edu.