Cost of Placing Players on the DL
The dollars lost were calculated by prorating the injured player’s daily salary and multiplying by the number of days missed on the DL. For example, if a player’s annual salary is $1,820,000, his daily salary for the 182 day season is $10,000. If assigned to the DL for 15 days, $150,000 is paid to that player while he is inactive and unable to play. An additional cost is the salary of the replacement player who fills the roster spot. For this work, the replacement player’s prorated, daily salary was assumed to be the league minimum for that specific year. For example, if the league minimum for a given season is $182,000, and the season is 182 days long, a replacement player earns a minimum of $1,000 per day while he is on the 25-man active roster. Thus, the dollars paid to the replacement would be $15,000. In this scenario, that brings the team’s total cost to $165,000 ($150,000 plus $15,000). Because the league minimum salary changes year to year, salaries specific to the year of injury were utilized in this analysis.
MUCL Injury Analysis
In order to better understand the evaluation of MUCL injuries over time, all MLB players undergoing MUCL reconstruction (“Tommy John surgery”) were analyzed separately. Similar to prior studies of UCL injuries, these players were identified using DL data, team websites, and publically available internet databases (primarily www.heatmaps.com).9,12,17-19 Variables studied include the number of procedures, year of surgery, player position, and mean time until return to play at the MLB level. All MLB players undergoing MUCL reconstruction since 1974 (the year the first procedure was performed) were included.
Statistical Methods
Epidemiologic data are reported using descriptive statistics (mean, range, and percentage) where indicated. To determine the significance of trends over time, a best-fit line was generated to illustrate the change over the years. These lines are reported with corresponding R2 values. To assess the trend for significance, the slope was compared to a line with a slope of zero (no change over time) using t tests. For all statistical comparisons, the threshold for alpha was set to P < .05.
Results
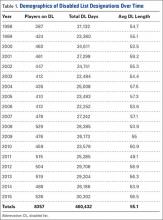
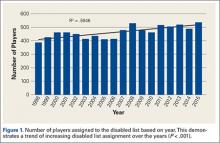
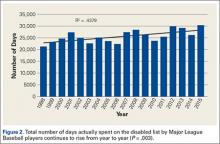
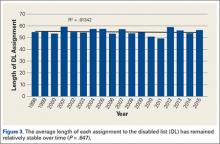
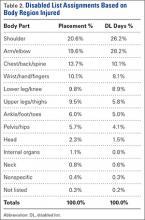
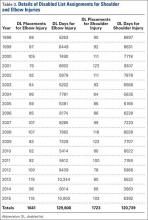
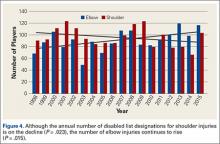
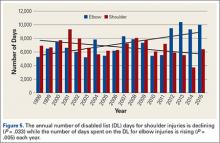
Between 1998 and 2015, there were 8357 placements of players on the DL, at an average rate of 464 designations per year (Table 1, Figure 1). This resulted in 460,432 days lost to injury, with a mean of 25,186 days out of play per season (Table 1, Figure 2). The mean length of DL assignment per year was 55.1 days per injury, with a low of 49.1 days in 2011 and a high of 59.2 days in 2001 (Table 1, Figure 3). During the study period, the number of players placed on the DL and the total number of DL days steadily increased (P < .001 and P = .003, respectively), while the average length of DL assignments remained steady (P = .647). When analyzing the data by body region injured, the shoulder (20.6%) and elbow (19.6%) were the 2 leading causes of time out of play (Table 2). This was followed distantly by the chest/back/spine (13.7%), wrist/hand/fingers (10.1%), lower leg/knee (9.8%), and the upper leg/thigh (9.5%). Although the percentage of injuries occurring to the upper extremity remained stable, the rate of shoulder injuries steadily decreased (P = .023) as elbow injuries increased (P = .015) (Table 3, Figure 4). This inverse relationship was also demonstrated for the annual number of DL days for shoulder (P = .033) and elbow (P = 0.005) injuries (Figure 5).
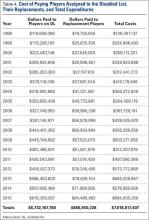
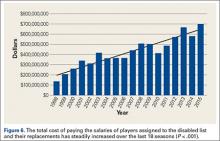
Regarding the financial impact of these injuries, the mean annual cost of replacing players on the DL was $423,267,633.78 (Table 4). This ranged from a low of $136,397,147 in 1998 to a high of $694,835,359 in 2015. There was a steady increase in the cost of replacement during the study period (P < .001) that coincides with the increasing salaries during that time span (Figure 6). In total, $6,732,167,180 was paid to players assigned to the DL and $886,650,228 was spent to fill their positions. This brings the total cost of DL assignments to $7,618,817,407 for the study period.
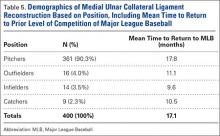
Looking specifically at MUCL injuries, a total of 400 MUCL reconstructions have been performed on MLB players since the procedure was first developed in 1974. The vast majority of these were performed in pitchers (n = 361, 90.3%) followed by outfielders (n = 16, 4.0%), infielders (n = 14, 3.5%) and catchers (n = 9, 2.3%) (Table 5). The mean time to return to competition at the MLB level was 17.8 months for pitchers, 11.1 months for outfielders, 9.6 months for infielders, and 10.5 months for catchers. The overall mean time to return was 17.1 months. The annual number of MUCL reconstructions continues to rise dramatically (P < .001) (Figure 7). During the first 12 years (1974-1985), a total of 8 (2.0%) MUCL reconstructions were performed on MLB players. In subsequent decades, this number increased to 44 (11.0%) from 1986-1995, 123 (30.8%) from 1996-2005, and 225 (56.3%) from 2006-2015. Of all Tommy John surgeries performed over 42 years, nearly one-third (n = 131, 32.75%) were performed in the last 5 years alone (2011-2015).

