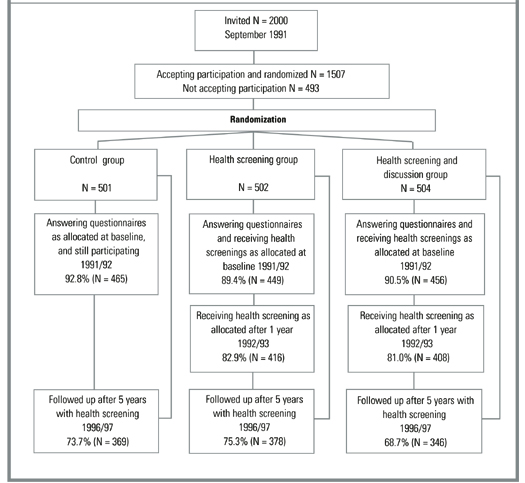
Figure 2 presents the flowchart of the study, focusing on participation in the health screenings. For the health discussions, the participation rate at baseline (1992) was very high. However, interest declined markedly in the follow-up period. Among baseline participants in the health screening plus discussion group, the percentage who agreed to the follow-up consultations was 97.1% in 1992, 35.7% in 1993, 16.9% in 1994, 15.1% in 1995, 8.6% in 1996, and 7.0% in 1997 (87.9% in 1992, 32.3% in 1993, 15.3% in 1994, 13.7% in 1995, 7.7% in 1996, and 6.5% in 1997 of all those randomized into the health screening plus discussion group). In total, 88.9% of those randomized into the health screening plus discussion group had at least 1 health discussion, 45.2% had at least 2 discussions, and 18.1% had at least 3 discussions.
TABLE 1
Baseline demographics and cardiovascular risk factors
| Control | Health screening | Health screening plus discussion | Valid N | |
|---|---|---|---|---|
| All participants | N = 501 | N = 502 | N = 504 | |
| Age in years | 40.4 (5.8) | 40.4 (5.6) | 40.6 (5.7) | 1507 |
| % males | 48.3 | 48.6 | 49.0 | 1507 |
| % cohabitating | 81.7 | 82.3 | 83.8 | 1496 |
| % smokers* | 51.4 | 51.4 | 53.9 | 1501 |
| BMI (kg/m2) | 24.4 (4.0) | 24.1 (3.6) | 24.6 (4.2) | 1463 |
| Screened participants | N = 449 | N = 456 | ||
| CRS | — | 5.69 (3.11) | 5.95 (3.07) | 905 |
| BMI (kg/m2) | — | 24.8 (3.8) | 25.3 (4.7) | 905 |
| Systolic BP (mm Hg) | — | 122.2 (14.5) | 123.0 (16.0) | 905 |
| Diastolic BP (mm Hg) | 77.7 (9.5) | 77.2 (10.0) | 905 | |
| Serum cholesterol (mmol/L)† | — | 5.60 (1.05) | 5.68 (1.06) | 905 |
| CO in exp. air (parts/million)‡ | ||||
| Among all | — | 3 (2–17) | 3 (2–16) | 905 |
| Among smokers | — | 17 (10–24) | 16 (8–24) | 461 |
| Values presented as mean (SD) unless otherwise noted. | ||||
| *Including occasional smokers. | ||||
| †To convert mmol/L to mg/dL, multiply by 38.7. | ||||
| ‡Median (25%–75% percentile). | ||||
| BMI, body mass index; BP, blood pressure; CO, carbon monoxide; CRS, cardiovascular risk score. | ||||
FIGURE 2
Flowchart of participation in The Ebeltoft Health Promotion Study, focusing on participation in the health screenings
Impact on cardiovascular risk
Table 2 shows the mean CRS and other cardiovascular risk factors at the 5-year follow-up. No significant differences were noted in any of the measures between the 2 intervention groups; therefore, data from these 2 groups are presented together. In comparison to the control group, participants in the intervention groups have a significantly lower CRS, BMI, and serum cholesterol level after 5 years. There were no significant differences between the control and intervention groups in terms of blood pressure. Differences between the control and the intervention groups are more pronounced among the baseline risk groups. Smoking and CO concentration were not significantly affected overall or between risk groups.
Table 3 shows a marked difference between the control and the intervention groups in the prevalence of persons with elevated CRS at the 5-year follow-up. The RR is reduced to about half—at the 5-year follow-up the prevalence of those with elevated CRS in the intervention groups is approximately half that in the control group. The absolute risk reduction is 8.6% (number needed to treat = 11.6). The same pattern is evident among baseline risk groups—the RR of having elevated CRS is reduced to about half, but with larger absolute risk reductions.
According to self-reported data at the 5-year follow-up, the positive impact on cardiovascular risk factors was not a result of medication. In the control group, 6.8% were using blood pressure medicine, compared to 4.8% in the intervention groups; 1.0% of the control group and 0.9% of the intervention groups were on heart medication, and 3.9% of the control group and 3.7% of the intervention groups were on diuretic medication.
TABLE 2
Cardiovascular risk score and other cardiovascular risk factors after 5 years of follow-up
| Control | Intervention | |
|---|---|---|
| All participants | N = 369 | N = 724 |
| CRS | 6.25 (3.47) | 5.69 (3.05)* |
| BMI (kg/m2) | 26.5 (4.4) | 25.9 (4.1)† |
| Systolic BP (mm Hg) | 132.6 (19.9) | 130.9 (18.2) |
| Diastolic BP (mm Hg) | 81.0 (11.7) | 79.8 (10.5) |
| Serum cholesterol (mmol/L)‡ | 5.68 (1.06) | 5.54 (1.03)† |
| Smoker participants | N = 181 | N = 345 |
| CRS | 7.47 (3.56) | 6.79 (3.11)† |
| BMI (kg/m2) | 26.2 (4.5) | 25.4 (4.0) |
| Systolic BP (mm Hg) | 132.8 (19.8) | 128.4 (17.4)* |
| Diastolic BP (mm Hg) | 80.9 (11.6) | 78.3 (10.2)* |
| Serum cholesterol (mmol/L)‡ | 5.73 (0.97) | 5.57 (1.07) |
| Overweight participants § | N = 58 | N = 111 |
| CRS | 9.28 (3.29) | 7.50 (2.99)* |
| BMI (kg/m2) | 33.6 (3.9) | 32.2 (3.6)† |
| Systolic BP (mm Hg) | 147.0 (22.3) | 139.0 (20.1)† |
| Diastolic BP (mm Hg) | 89.8 (12.3) | 84.4 (10.7)* |
| Serum cholesterol (mmol/L)‡ | 6.20 (1.12) | 5.81 (0.96)† |
| Values presented as mean (SD) unless otherwise noted. | ||
| *P < .01; | ||
| †P < .05. | ||
| ‡To convert mmol/L to mg/dL, multiply by 38.7. | ||
| §Self-reported BMI ≥ 27.5. | ||
| BMI, body mass index; BP, blood pressure; CO, carbon monoxide; CRS, cardiovascular risk score. | ||
TABLE 3
Prevalence proportion and relative risk of having elevated cardiovascular risk score or other cardiovascular risk factors, after 5 years of follow-up
| Control (%) | Intervention (%) | Intervention/control RR (95% CI) | |
|---|---|---|---|
| All participants | N = 369 | N = 724 | |
| Elevated or high CRS (≥10) | 18.7 | 10.1* | 0.54 (0.40–0.73) |
| BMI (≥27.5 kg/m2) | 35.0 | 30.8 | 0.88 (0.74–1.05) |
| Systolic BP (≥140 mm Hg) | 30.9 | 27.1 | 0.88 (0.72–1.06) |
| Diastolic BP (≥90 mm Hg) | 21.1 | 16.2† | 0.77 (0.59–0.99) |
| Serum cholesterol (≥6 mmol/L)‡ | 39.0 | 31.4† | 0.80 (0.68–0.95) |
| Smoker participants | N = 181 | N = 345 | |
| Elevated or high CRS (≥10) | 28.7 | 16.5* | 0.58 (0.41–0.80) |
| BMI (≥27.5 kg/m2) | 33.7 | 29.3 | 0.87 (0.67–1.13) |
| Systolic BP (≥140 mm Hg) | 31.5 | 23.2† | 0.74 (0.55–0.98) |
| Diastolic BP (≥90 mm Hg) | 22.1 | 12.5* | 0.56 (0.38–0.83) |
| Serum cholesterol (≥6 mmol/L)‡ | 40.3 | 32.5 | 0.81 (0.64–1.02) |
| Overweight participants§ | N = 58 | N = 111 | |
| Elevated or high CRS (≥10) | 46.6 | 21.6* | 0.46 (0.30–0.73) |
| BMI (≥27.5 kg/m2) | 100.0 | 91.9† | 0.92 (0.87–0.97) |
| Systolic BP (≥140 mm Hg) | 63.8 | 36.9* | 0.58 (0.42–0.79) |
| Diastolic BP (≥90 mm Hg) | 46.6 | 26.1* | 0.56 (0.37–0.85) |
| Serum cholesterol (≥6 mmol/L)‡ | 58.6 | 41.4† | 0.71 (0.52–0.96) |
| *P < .01; | |||
| †P < .05. | |||
| ‡ To convert mmol/L to mg/dL, multiply by 38.7. | |||
| §Self-reported BMI ≥ 27.5. | |||
| BMI, body mass index; BP, blood pressure; CRS, cardiovascular risk score; RR, relative risk. | |||