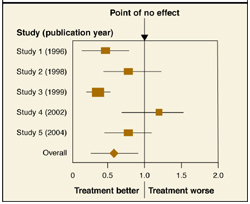
A forest plot, which most commonly appears in meta-analyses, summarizes results of individual studies and includes a combined or “pooled” estimate of the overall result.
The Figure shows a forest plot with the relative risk (RR) estimates from 5 studies of a new medication for the prevention of stroke. It includes the RR of the incidence of stroke with the new medication vs placebo. If the RR is <1.0, the treatment group has a lower incidence rate than placebo. An RR of 1.0 indicates no difference. The individual squares represent each study’s RR estimate. The lines extending from the squares represent the 95% confidence interval (CI) for the estimate. The size of the square corresponds to the size of the study and therefore the precision of the estimate.
In this example, Study 1 and Study 3 favor the new medication vs placebo. The larger square in Study 3 indicates a larger sample size and more precise result than Study 1. Study 2 also favors the new medication, but since its CI crosses the point of no effect, this result is not statistically significant. The pooled estimate is indicated with a diamond at bottom. Its CI does not cross 1.0, meaning, overall, the result of the meta-analysis is statistically significant and favors the new medication.
A forest plot is an effective way to represent data for a couple of reasons. Results of individual studies, usually with dates of publication and CIs, are summarized with a pooled result. One can also quickly see how much variation exists among studies (ie, whether the individual estimates are distributed tightly around one point or spread widely apart) and the degree of precision of each study.
Figure
Relative risk of the indicence of stroke
Correspondence
Julie Yeh, MD, UPMC St. Margaret Faculty Development Fellowship Program, 3937 Butler St, Pittsburgh, PA 15215. E-mail: yehja@upmc.edu.